The Parcel Report Sidebar: Overview, Activity, Agriculture, and Energy Tabs
How to open a parcel report, read the Overview, Activity, Agriculture, and Energy tabs, ask the AI Assistant about the land, drill into an operator's full footprint, download a branded PDF, and share a report link.
When you look up a quarter section on Township Canada, the report opens in a panel docked to the right of the map. The map stays live underneath, so you can keep panning and toggling map layers while you read. This guide covers everything in that sidebar.
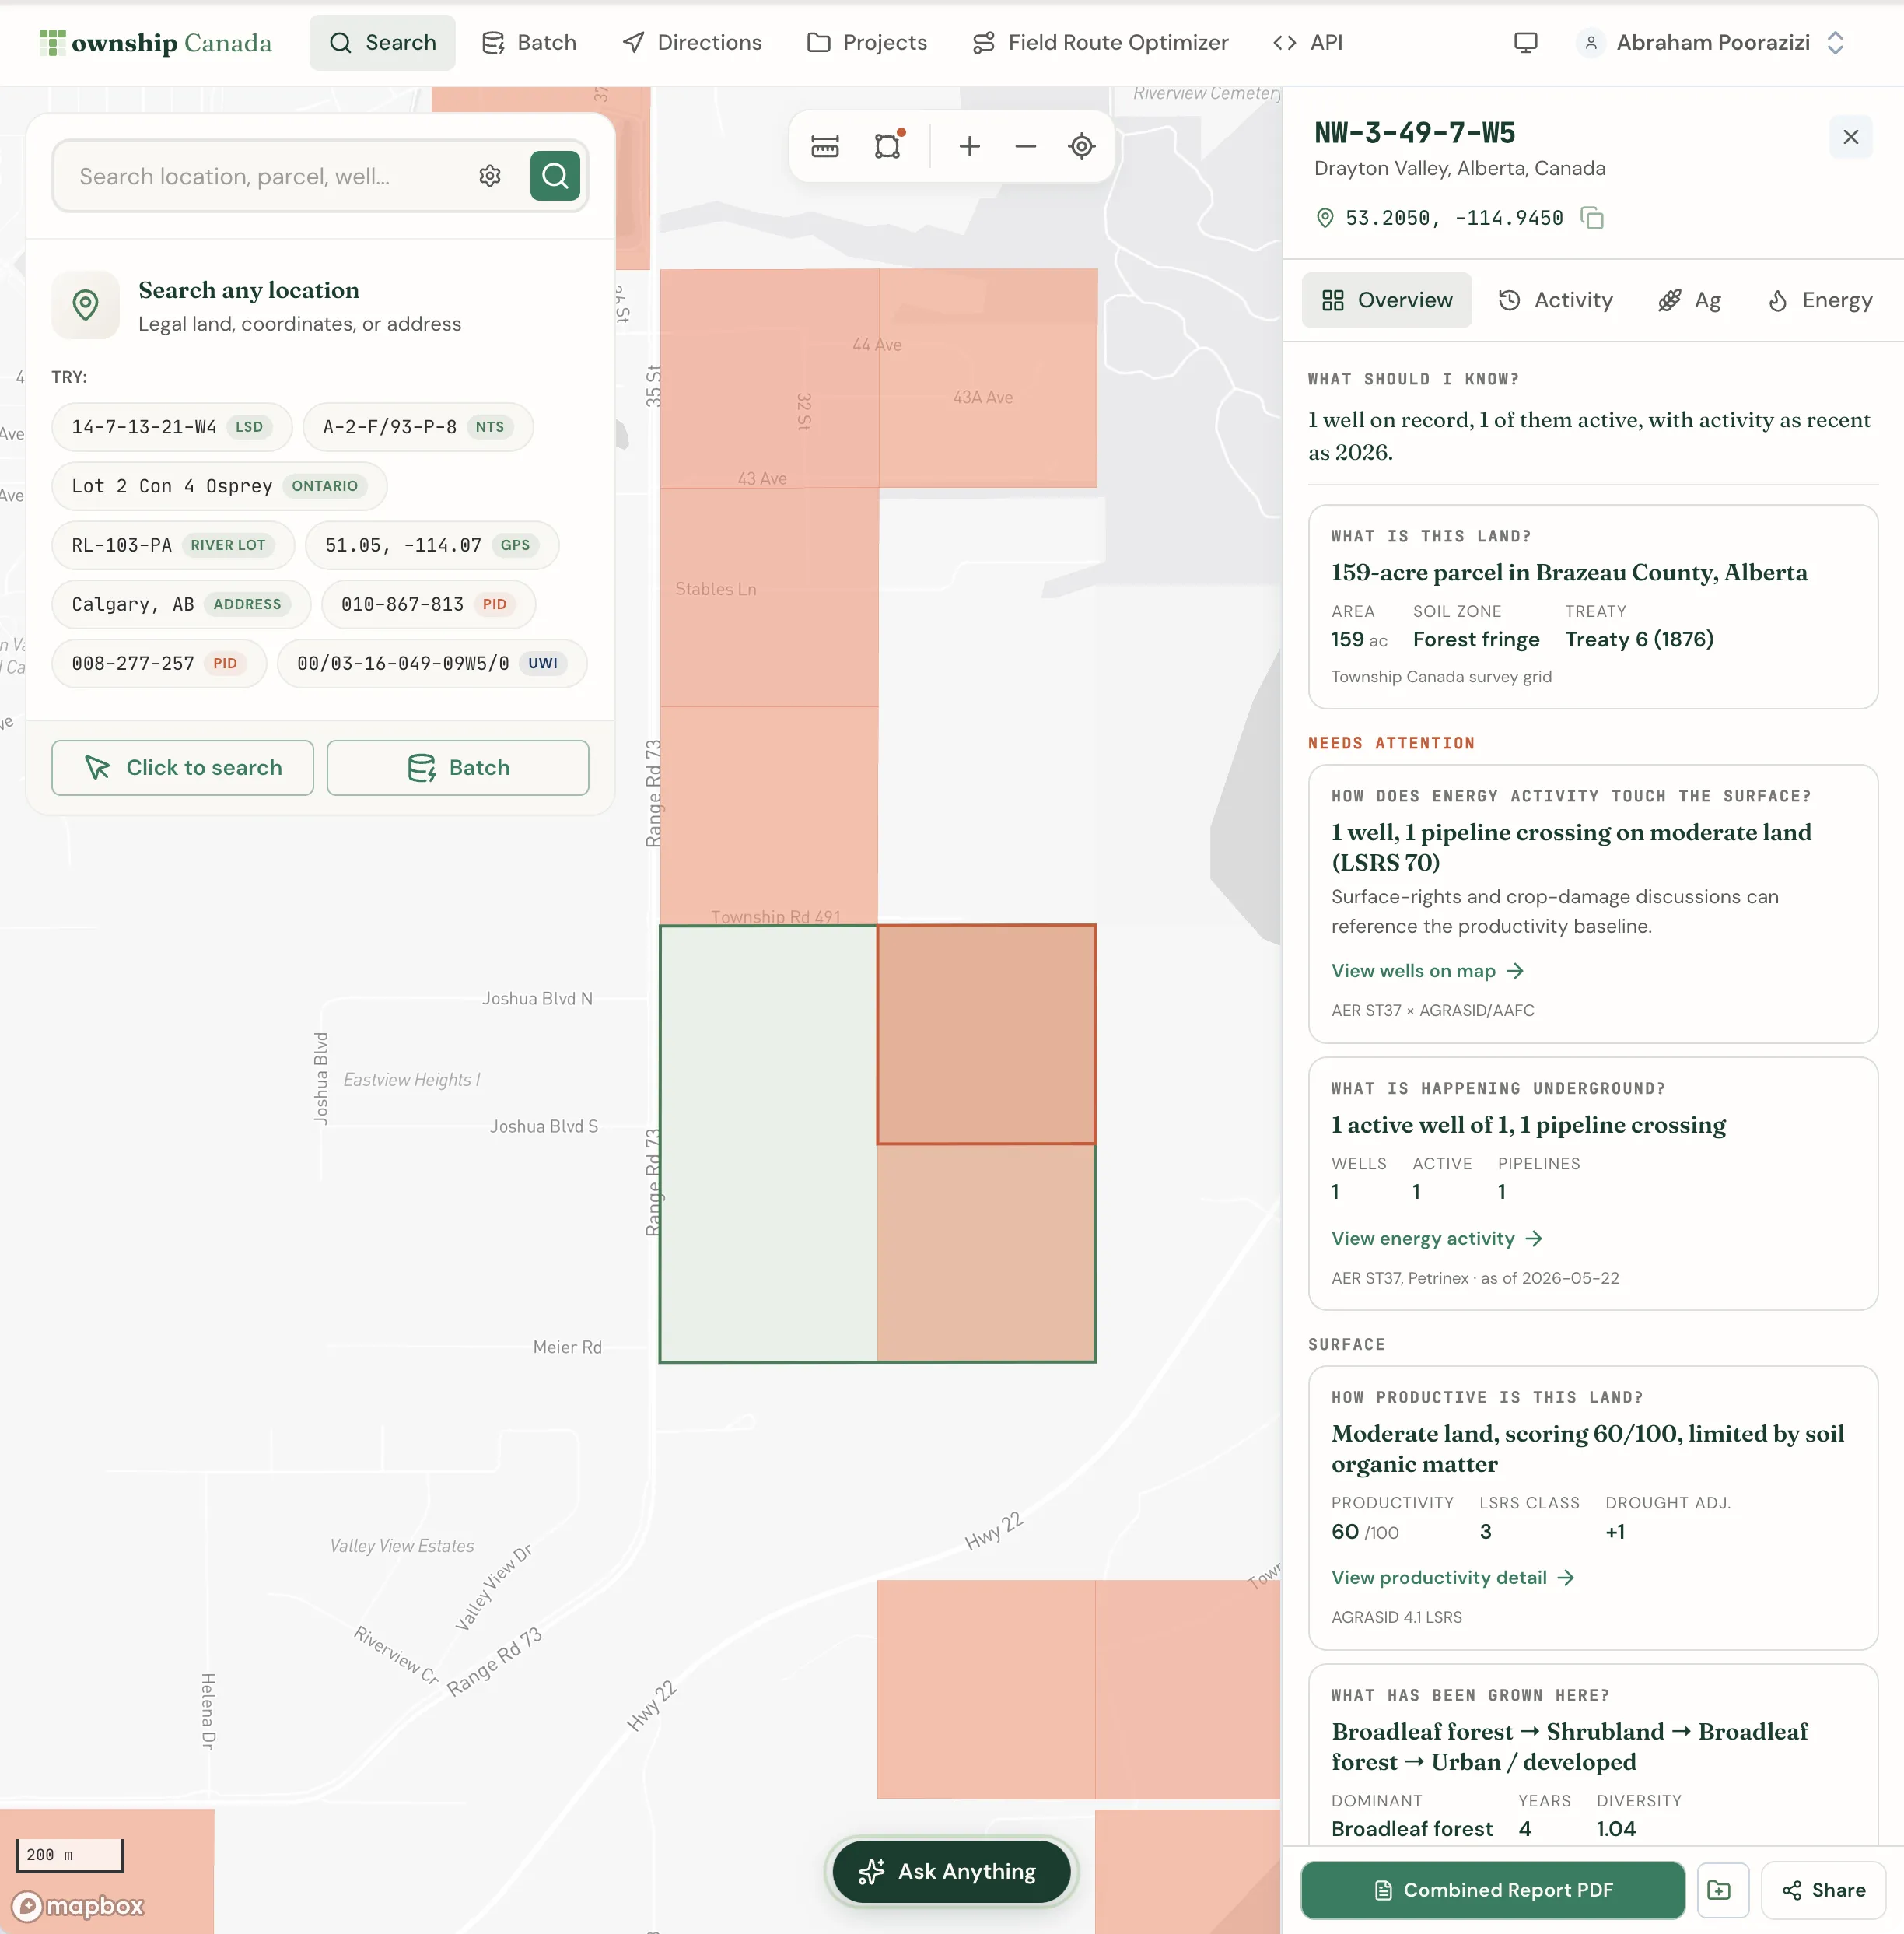
Opening a report
There are four ways in:
- Search a legal land description in the search box and select the parcel.
- Click the map on a quarter section.
- Open a shared link someone sent you.
- Use the one-click parcel report from anywhere in the app.
The sidebar opens at the parcel's Overview. It is 400 px wide on desktop and goes full-width on phones. Close it with the X; the report only closes on that explicit action, so an accidental click on the map will not lose your place.
The four tabs
Every report has the same four lenses, shown as pills under the header:
- Overview - the thirty-second read, always available.
- Activity - the dated history of the land, unlocked by either bundle.
- Ag - the agronomic report, unlocked by the Agriculture Bundle.
- Energy - the subsurface report, unlocked by the Energy Bundle.
A tab you do not yet have shows a small lock icon. Open it to see what it holds for this parcel and a one-step upgrade. The tabs you can open depend on which bundles you carry; see which report you need.
Reading the Overview
The Overview is organized around one question: What should I know? Instead of a wall of statistics, it answers the questions people actually ask about a piece of land, in plain English: What is this land? How productive is it? What has been grown here? What is happening underground? Are there well liabilities here? Who holds tenure or mineral interests? Each answer card gives a one-sentence finding, the few figures behind it, and a link to the evidence, which opens the right tab, drills into an operator or disposition, or turns on the matching layer on the map.
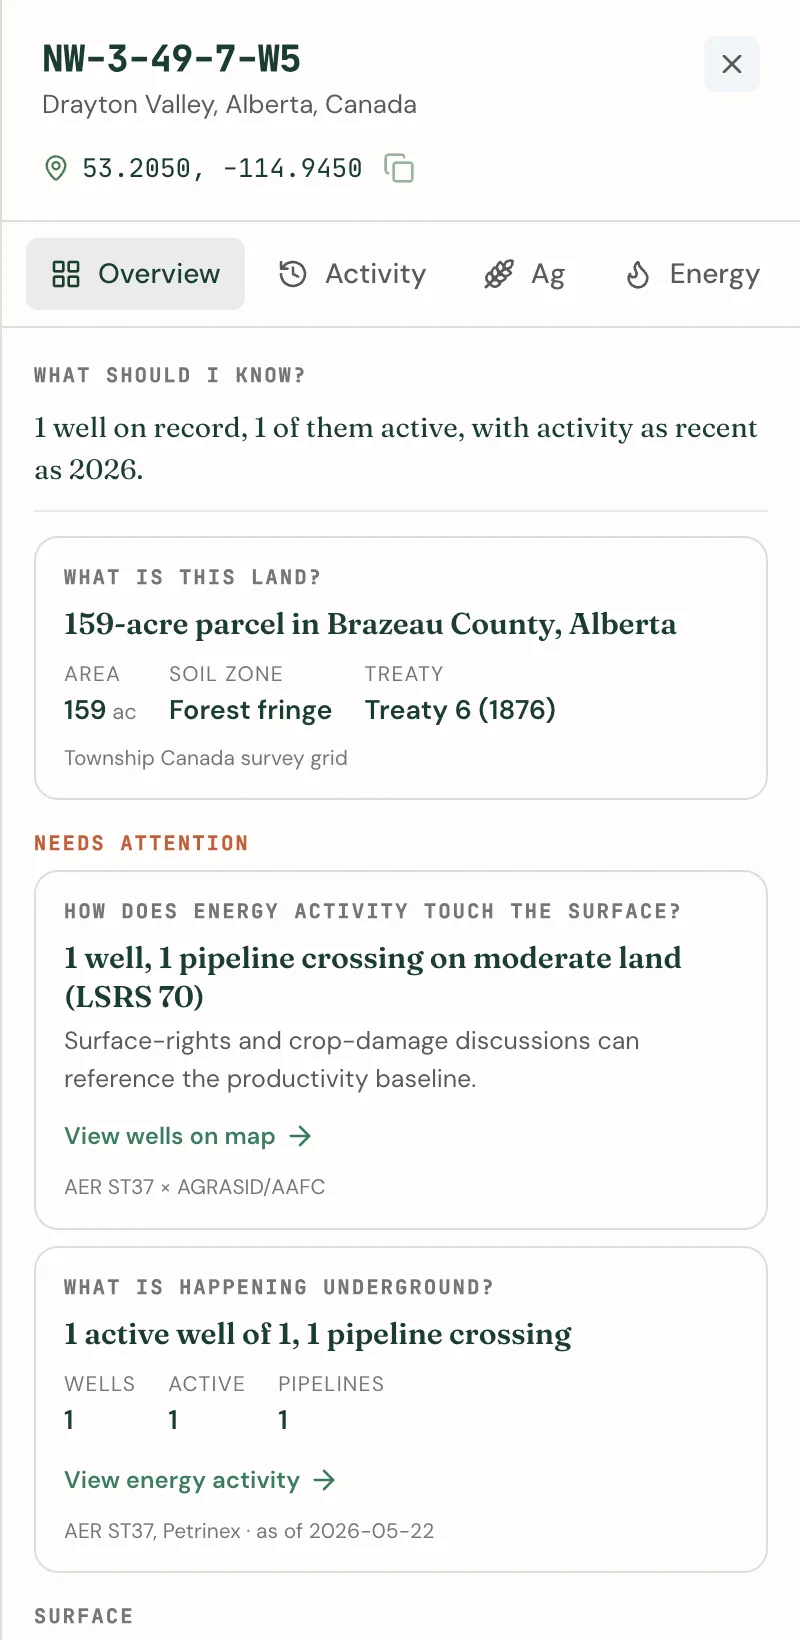
A few things make the Overview quick to trust:
- The most important findings come first. Anything that needs attention, such as orphan wells or a well and pipeline crossing productive cropland, is lifted into a Needs attention strip at the top. The rest is grouped under How things interact, Surface, Subsurface, Interests, and Constraints.
- A short brief sits above the cards when the parcel carries wells, saying whether that footprint is active or has gone quiet, and since when.
- "None found" and "not available" never look the same. Zero wells on a covered Alberta parcel is a finding about the land. Production on a Manitoba parcel is not published, so the card says the data is not available rather than showing a misleading zero.
- Questions your bundles do not cover stay visible, with a lock, so you can see what the other bundle would answer for this parcel.
Below the cards, follow-up chips such as Show wells on the map, Open the dominant operator, and Which tenure expires first? take you straight to the next step.
Ask about this land
With a bundle active, the Overview also offers Ask about this land chips: Who operates wells here? and What tenure expires soon? with the Energy Bundle, and How does this land compare? with the Agriculture Bundle. Tap one and the AI Assistant opens with the question already asked about this parcel. It answers from the same data as the report and can link you back into the sidebar.
The Activity tab
The Activity tab lays out the parcel's history on a timeline, newest first and grouped by year. Every entry carries a real, published date; nothing is guessed from today's snapshot.
- With the Energy Bundle: well licences, drilling and other well milestones, Crown tenure issues, and the last month the land recorded production.
- With the Agriculture Bundle: the crop grown each year and changes in drought class.
An Ahead strip at the top lists upcoming tenure expiries, kept separate from the history so you can see what is coming due. Select a tenure event to open its disposition, or an Alberta well event to open the well.
The data published for each province differs. If a province does not publish dated events, the tab says so plainly, so an empty timeline is never mistaken for a quiet parcel.
The Agriculture tab
With the Agriculture Bundle, the Ag tab carries the full agronomic report for the quarter section:
- the Productivity Score (0-100) and the single limiter capping it. In Alberta the score draws on LSRS ratings from AGRASID; elsewhere it is an estimate from national soil landscape data, and the tab labels it as one,
- Soil: order, group, and subgroup, with drainage and slope,
- Land use: the AAFC land-use class, with the CLI capability class alongside,
- Crop history: the five-year crop rotation, dominant crop, and a diversity index,
- Climate capability: the CLI climate class and score, the primary limiter, and the current drought reading,
- Wetlands and water: mapped wetland area and type on the quarter section, any open water, and the nearest watercourse and water body within 500 m, each with a map toggle,
- Drought: the current Canadian Drought Monitor status on the D0 to D4 scale, and
- Flood susceptibility: how many acres of the quarter score 50 or higher on NRCan's flood susceptibility maps today, the spread across bands, a year-by-year chart from 2000 to 2023 with the highest years called out, and a trend when there is a meaningful one. Open water is left out of the numbers and reported on its own. This is a screening signal, not a flood hazard map; use provincial flood hazard maps for site decisions.
The method behind the score is documented in the Productivity Score methodology.
British Columbia parcels
British Columbia has no quarter-section grid, so its parcels get their own Ag tab built on ParcelMap BC:
- an Agricultural Land Reserve verdict up top: whether the parcel is in the ALR and how much of it is protected farmland,
- Agriculture Capability: BC's 7-class rating (1 is prime, 7 is non-arable), with the limiting factors,
- Soil survey: the dominant soil for each survey polygon on the parcel, with drainage, texture, parent material, and slope, and
- Wetlands: the mapped wetland extent from the Freshwater Atlas.
The Energy tab and operator drill-downs
With the Energy Bundle, the Energy tab opens with a status summary (wells, pipeline length, facilities, the dominant operator, and active, abandoned, and orphan counts), then a card for each part of the subsurface picture:
- Wells and Pipelines on the parcel,
- Facilities: batteries, gas plants, compressors, and other licensed sites, including Manitoba batteries and their associated facilities,
- CCS and geothermal: carbon capture and storage tenure, geothermal tenure, and CO2 injection wells from Alberta's energy data, whenever any of them touch the parcel,
- Operators and Crown tenure,
- Production over the trailing twelve months (not shown for Manitoba, which does not publish per-well volumes), and
- Drought vs production for Alberta and Saskatchewan parcels: how much oil and gas production across the basin sits in each current drought class, with this parcel's own drought class and production alongside.
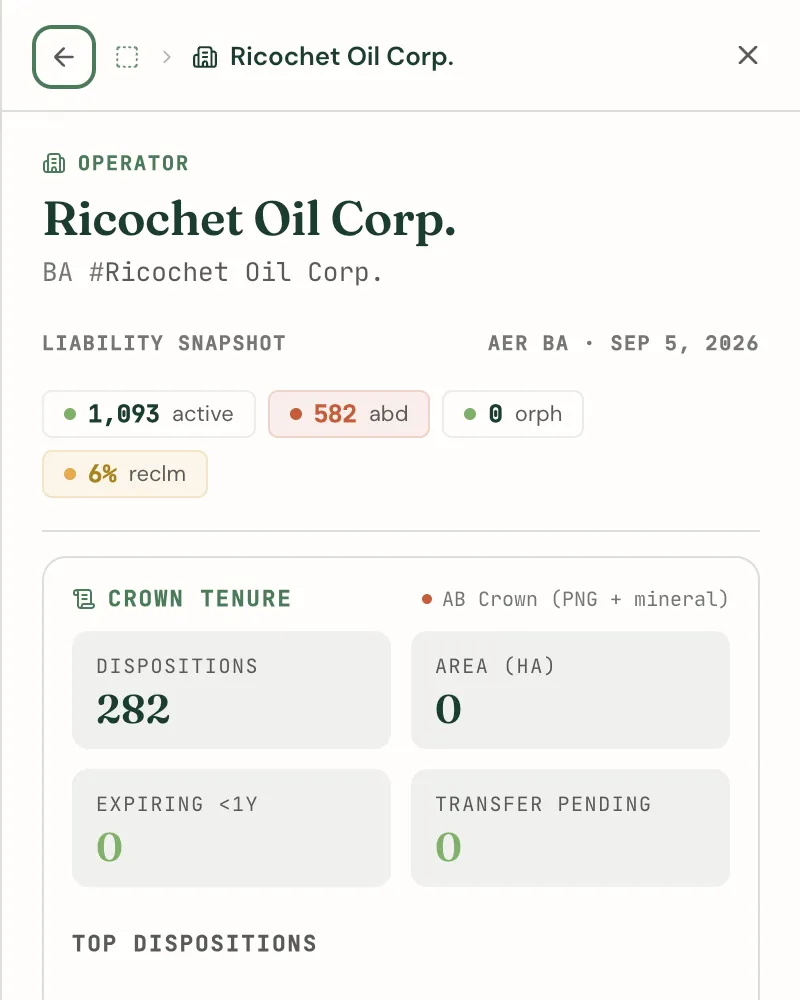
This is where the sidebar becomes a workspace rather than a single screen. From a report you can drill, and a breadcrumb with a back arrow keeps your trail:
- open an operator to see its full footprint (active, suspended, abandoned, orphan, and reclaimed counts across the AER inventory),
- open that operator's dispositions, wells, or footprint tables,
- open a single well or pipeline for its detail,
- open a disposition for its Crown tenure detail, and
- open the expiring tenure watchlist to see what is renewing soon.
Download a PDF, save, and share
The footer carries the actions that turn a report into a deliverable:
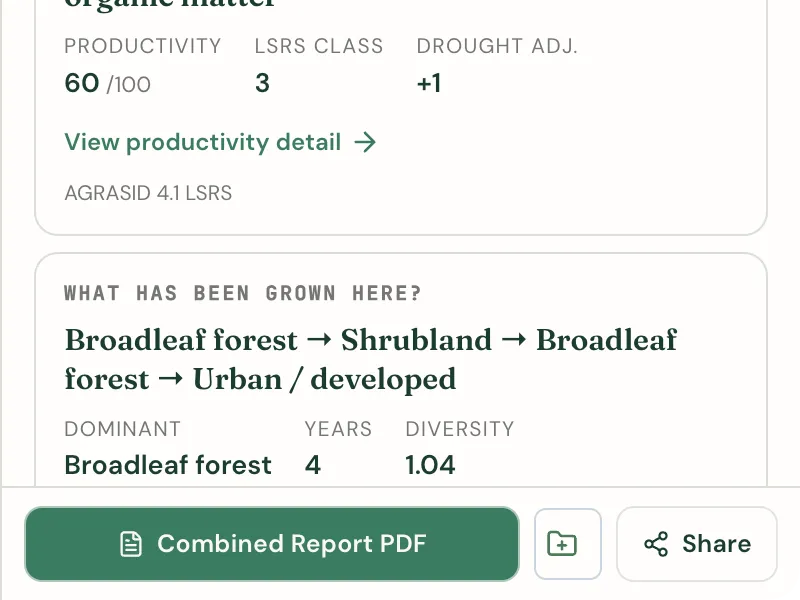
- The PDF button follows the tab you are on. From the Ag tab it builds the Ag Report PDF, from the Energy tab the Energy Report PDF, and from the Overview or Activity tab with both bundles, a single Combined Report PDF.
- Save (the folder icon) adds the parcel to one of your projects.
- Share copies the report's URL to your clipboard. Anyone who opens it lands on the same parcel and tab.
The PDF button opens the branded report in a new tab: a cover page, then the Agriculture and Energy sections your bundles include, with a short written analysis alongside the figures. Two buttons sit at the bottom of the page:
- Download PDF produces a ready-made PDF file that looks the same whatever browser you use. It waits until the written analysis has finished (the button reads "Writing analysis…" in the meantime).
- Print uses your browser's print dialog, where you can also save as PDF. It works right away; if the written analysis is still being prepared, the printout goes without it.
Coverage
The Agriculture and Energy tabs cover all four western provinces: Alberta, Saskatchewan, and Manitoba on the DLS quarter-section grid, and British Columbia through its NTS and ParcelMap BC parcels (British Columbia is not DLS-surveyed). When you open a parcel outside the supported areas, the sidebar shows a coverage notice and what is available there instead of empty cards, so you always know whether the data exists for that location.
Related guides
- Map Layers - paint the same data across the whole grid
- AI Assistant - ask follow-up questions about a parcel
- One-click parcel report
- Energy, Agriculture, and Combined Parcel Reports
Related Guides
AI Assistant - Ask Questions About Legal Land Descriptions
Use Township Canada's AI Assistant to convert legal land descriptions, get directions, validate formats, ask about a parcel's wells, soil, crops, and flood history, and learn about DLS, NTS, and Geographic Township systems through natural conversation.
Batch Convert Legal Land Descriptions - 5,000+ Records
Convert thousands of legal land descriptions to GPS coordinates and vice versa in seconds. Export to CSV, KML, Shapefile, DXF, or GeoJSON. Perfect for oil & gas, real estate, GIS, and agriculture.
Using Township Canada for Delivery & Field Route Planning
Plan efficient delivery routes and field visits using legal land descriptions. Convert LSD lists from spreadsheets, visualize stops on a map, and get driving directions.