By Township Canada
What's Behind the Map: A Guide to Township Canada's Energy and Agriculture Data Sources
Township Canada now publishes 19 data-source pages explaining every dataset in the Energy and Agriculture bundles - where it comes from, what it carries, how often it refreshes, and how it appears on the map and in the parcel report.
You're evaluating a quarter section near Drumheller for a surface lease. You need to know how many wells are on it, who operates them, whether any are orphaned, when the Crown tenure expires, what's been grown on the surface for the last five years, and whether the soil is any good. That information exists — but it's scattered across the AER's GeoView, a Petrinex spreadsheet, the AAFC crop inventory viewer, and the AGRASID soil portal.
Township Canada pulls all of it into one search and one report. But you shouldn't have to take our word for what's in the data. That's why we've published 19 dedicated data-source pages — one for every dataset in the Energy Bundle and the Agriculture Bundle — each explaining exactly where the numbers come from, what attributes the dataset carries, how often it refreshes, and how Township Canada surfaces it on the map and in the parcel report.
This post walks through the new data-source catalogue, highlights the key datasets in each bundle, and shows you where to find the detail pages.
The problem these pages solve
Every layer on the map has a story: who publishes the data, what fields it contains, what geography it covers, and how current it is. If you're attaching a parcel report to a regulatory filing or handing it to a client as part of a due-diligence package, knowing the provenance matters.
Before these pages, that meant digging through AER bulletins, AAFC metadata sheets, and Petrinex documentation to verify what you were looking at. The data-source pages put the answers in one place, linked directly from the industry pages and the data-source index.
What each data-source page tells you
Every page follows the same structure:
- What the dataset is — the official name, who publishes it, and what it represents.
- What it carries — the specific attributes Township Canada ingests (well status, pipeline substance, soil subgroup, crop type, and so on).
- Coverage and refresh cadence — which provinces it covers and how often the data updates (monthly for most energy sources, annually for soil and crop).
- How Township Canada shows it — where the dataset appears: which map layer renders it, which parcel-report tab displays it, and which presets use it.
No marketing claims, just the facts about the data.
Energy Bundle: twelve datasets, one LSD
The Energy Bundle draws on twelve public sources, all joined to the Legal Subdivision grid. Here are the four that come up most often.
AER ST37 — the List of Wells
ST37 is the Alberta Energy Regulator's complete register of every well ever licensed in the province. Township Canada carries more than 530,000 wells with their lifecycle status — active, suspended, abandoned, reclaimed, and the orphan flag where the Orphan Well Association has taken over closure. It refreshes monthly from the AER's open-data release.
On the map, ST37 powers the AER Wells layer. On the parcel report, it populates the well list on the Energy tab: every well whose surface point falls inside the LSD, with UWI, operator, product, and status.
Petrinex Volumetrics — production at the well level
Petrinex volumetrics are the public production reports that operators file in Alberta and Saskatchewan. Township Canada derives trailing-12-month volumes per well and per LSD — oil, gas, water, condensate, and the smaller streams. The dataset covers roughly 364,000 well-level records and close to 300,000 LSD-level rollups, refreshed monthly.
On the map, the LSD Production layer colours the grid by trailing-12-month oil volume, so producing quarters light up and dead ground stays clear. That single view is how you screen an acquisition target or prioritize a field visit.
CCS pore-space tenure
CCS tenure tracks Alberta's carbon-capture-and-storage agreements — the pore-space rights, project boundaries, and injection wells that serve them. It's an emerging dataset that grows as the province grants new sequestration hubs.
For teams scoping CCS submissions, this layer shows existing pore-space rights against the DLS grid — critical context before you commit to a site.
Oil and gas fields
O&G fields are the named field and pool polygons published by provincial regulators in Alberta, British Columbia, and Saskatchewan. They give you the geological context that a well-by-well view lacks: which named pool a cluster of wells produces from, and where one field ends and another begins. Useful for acquisition targeting and any reporting that references a field by name.
The full Energy Bundle also includes AER ST76 pipelines, AER ST102 facilities, Crown PNG tenure, Crown mineral tenure, orphan and abandoned wells, the BA snapshot, Petrinex well status, and geothermal tenure. Each has its own page with the same provenance detail.
Agriculture Bundle: seven datasets, one quarter section
The Agriculture Bundle draws on seven federal and provincial sources, all joined to the quarter section.
AGRASID and the LSRS productivity score
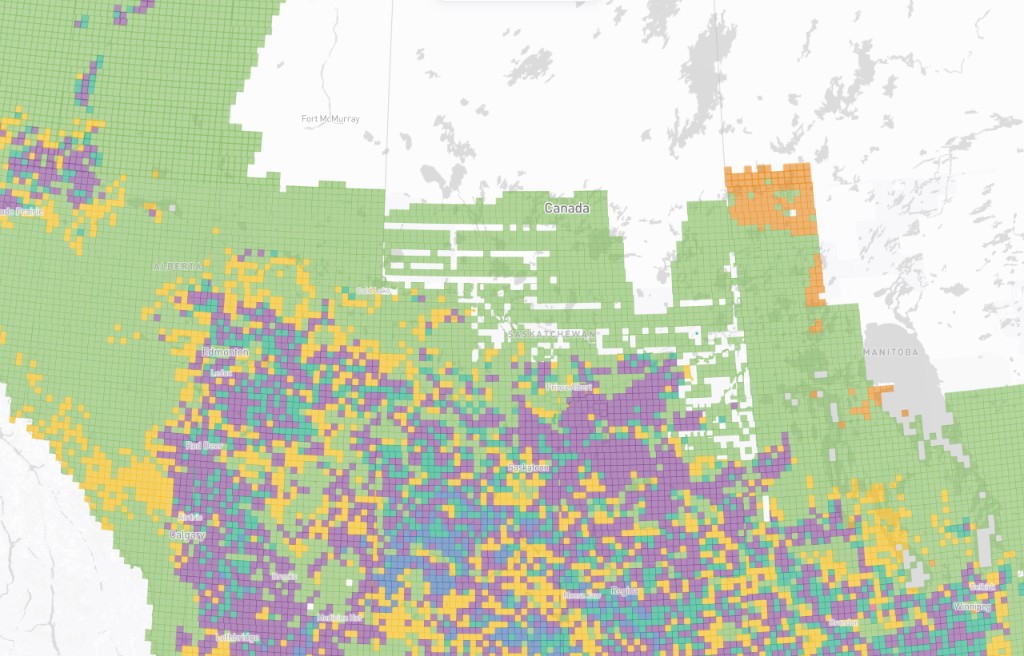
AGRASID 4.1 is Alberta's authoritative soil database. It carries soil subgroup, drainage, parent material, slope, and salinity for each polygon. More importantly, it's the source of the Land Suitability Rating System (LSRS) productivity score — a 0-100 rating for dryland spring-cereal cropland that Township Canada reports per quarter section, along with the single factor capping it (climate, moisture, soil, water, or continuous cropping).
More than 380,000 Alberta quarter sections already carry an LSRS score. Outside Alberta, the Soil Landscapes of Canada fallback supplies the soil context.
AAFC Annual Crop Inventory — five years of what's been grown
The AAFC Annual Crop Inventory is a satellite-derived crop classification covering more than 1.7 million Prairie quarter sections. Township Canada samples it per quarter section and builds a five-year rotation with the dominant crop and a Shannon diversity index that rewards a varied rotation over a persistent monoculture.
For a farmland appraiser, it's the difference between "160 acres near Barons" and "160 acres that's grown a peas-spring wheat-lentils rotation for five years." One of those you can price.
Canadian Drought Monitor — weekly conditions
The Canadian Drought Monitor publishes monthly severity polygons on the D0 to D4 scale. Township Canada intersects them with the quarter section to produce the current drought class on the report and a drought modifier that adjusts the productivity score — D0 leaves it unchanged, D4 applies a 15% penalty.
Two parcels with identical soil can score differently this month if one sits inside a D2 polygon. That's the kind of present-condition signal a static soil map doesn't capture.
The Agriculture Bundle also includes AAFC land use, the Canada Land Inventory, and the composite quarter-section layer, each with its own data-source page.
Where to find the pages
Three ways in:
- The data-source index at /learn/data-sources lists all 19 pages, split into Energy and Agriculture sections.
- The industry pages at /industries/oil-and-gas and /industries/agriculture link each data card to its detail page.
- Two new feature guides — the Map Layers guide and the Parcel Report Sidebar guide — walk through the controls that display this data.
Try it yourself
The fastest way to see the data behind the map is to pull a parcel report. Search a quarter section you know — or try 14-7-13-21-W4 near Barons, Alberta — and look at what shows up on the Energy and Agriculture tabs. Then follow the source link on any card to its data-source page and see exactly where the numbers come from.
The Energy and Agriculture bundles are each $50 CAD/month, stacked on a Pro or Business plan. Add them from the pricing page or from your account. Both bundles are needed for the combined parcel report that puts what's growing and what's underground in one PDF.