NRCan Flood Susceptibility: How Likely Land Is to Flood
Natural Resources Canada's Flood Susceptibility Mapping shows how likely land across Canada was to flood from 2000 to 2023, at 30 m. Township Canada shows it as a map layer and summarises it for every quarter section in the Agriculture parcel report.
What it is
Flood susceptibility describes how likely a piece of land is to flood, based on where floods have happened before and on the conditions that tend to come with them. Natural Resources Canada (NRCan) publishes a national Flood Susceptibility Mapping series, produced by the Canada Centre for Mapping and Earth Observation. Township Canada carries the present-day estimate, which averages susceptibility over 2000 to 2023 at a 30-metre resolution.
NRCan built the maps with XGBoost, a machine learning method that combines many small decision trees into one prediction. The model learns from historic flood events together with (1) land characteristics such as elevation, soil type, land cover, and vegetation, and (2) seasonal weather such as rainfall and temperature. NRCan ran the model many times on slightly different samples of the data to measure how stable its answers are.
What it carries
Every 30 m cell carries one value from 0 to 100, NRCan's calibrated probability of flood susceptibility. A higher value means the land was more likely to flood in a given year over 2000 to 2023. There are no classes or cut-offs, so read it as a continuous scale.
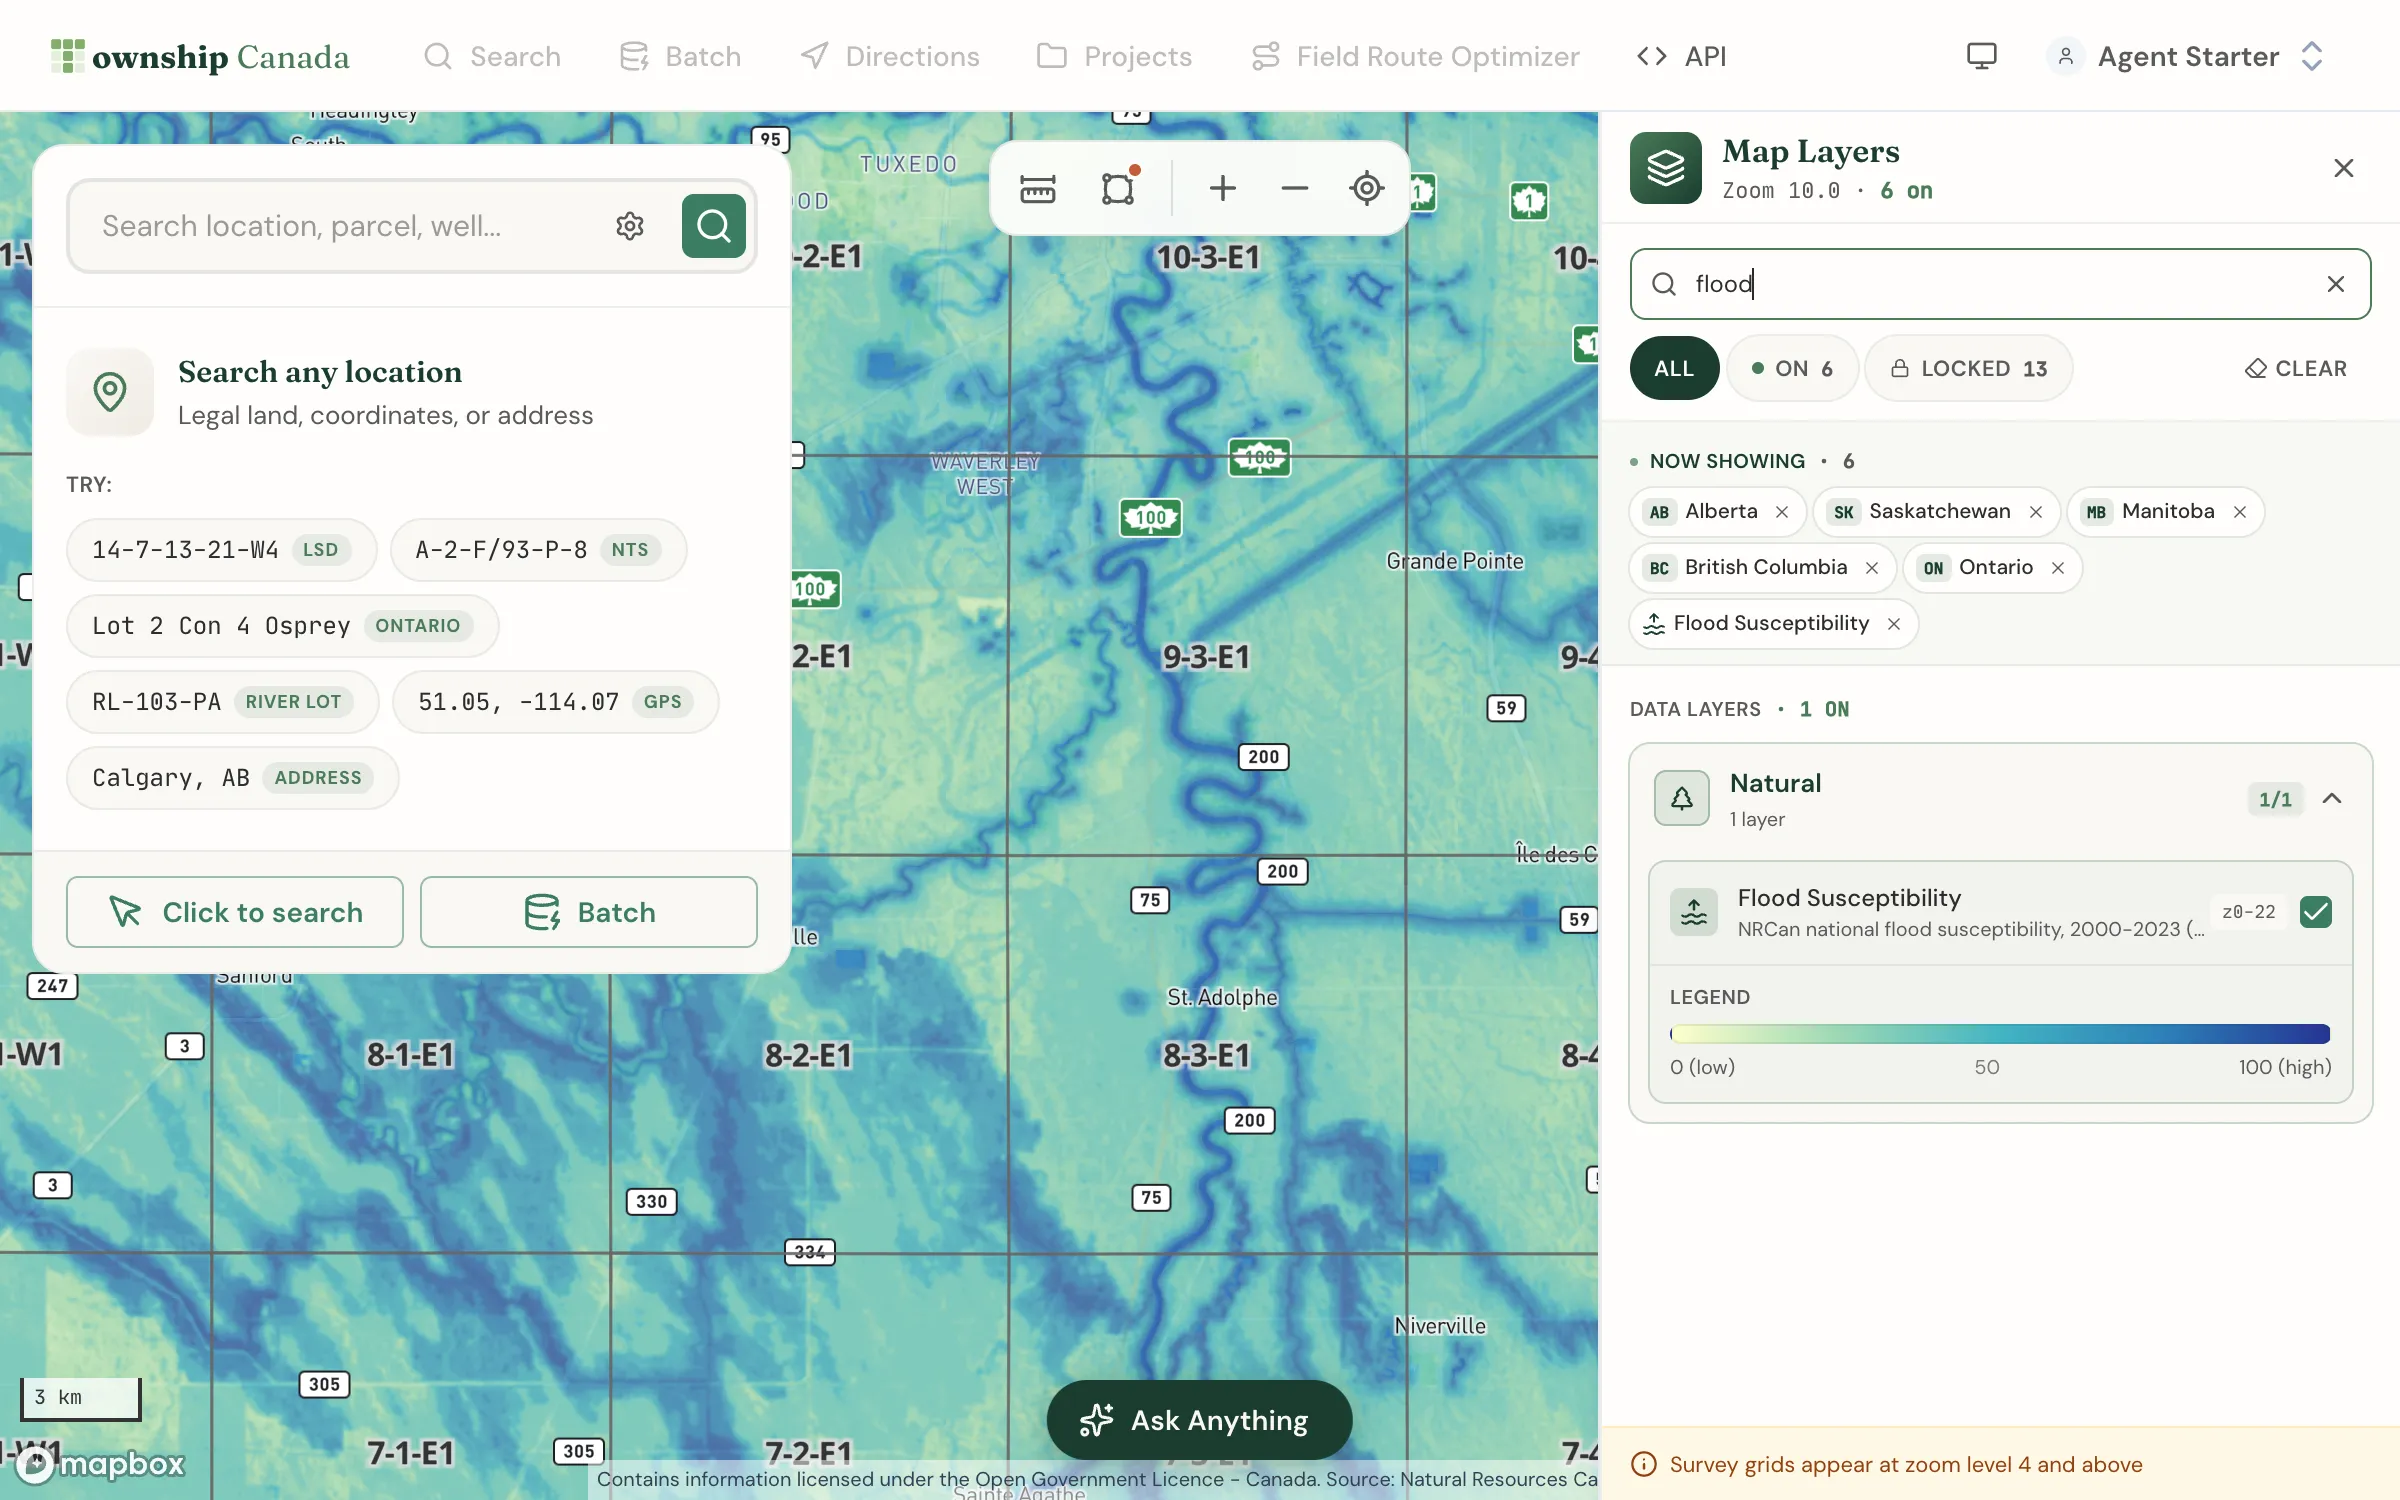
Township Canada shows the values unchanged, in NRCan's own colour ramp: pale yellow for low values, through green and teal, to dark blue for high values. Lakes, rivers, and some nearshore waters also carry values and usually read high.
Coverage and refresh
The present-day estimate covers all of Canada, from Lake Erie to the Arctic islands. NRCan published it in March 2026, and we refresh the layer when NRCan releases a new edition.
Contains information licensed under the Open Government Licence - Canada. Source: Natural Resources Canada - Flood Susceptibility Mapping.
How Township Canada shows it
Township Canada shows NRCan's flood susceptibility in two places:
- Map layer: on every paid plan. Open Map Layers, expand Natural, and turn on Flood Susceptibility. It draws from the national view down to street level and sits under the survey grid, so you can read each quarter section and LSD against it.
- Agriculture parcel report: with the Agriculture Bundle, the Agriculture tab of a parcel report includes a Flood susceptibility card for Alberta, Saskatchewan, and Manitoba quarter sections. An LSD shows the card for the quarter section that contains it.
The report card answers two questions: how much of this land is flood-prone, and is that changing? It shows:
- Acres of land scoring 50 or higher today: the headline number, from NRCan's present-day estimate. For example, "89 of 153 acres of land score 50 or higher today." The present-day estimate follows recent years closely rather than the 24-year average, so on land where susceptibility has risen it can sit above most of the bars in the history.
- The spread across four bands (0 to 24, 25 to 49, 50 to 74, and 75 to 100), in the same colours as the map layer, with today's average and 90th percentile. The 90th percentile is the value that 90% of the quarter's land sits at or below, so it shows how high the wettest part of the quarter reaches.
- The 2000 to 2023 history: one bar per year from NRCan's annual maps, with the three highest years named. Along the Red River, for example, 2011 stands out, which was a major flood year there.
- The trend: rising, falling, or no clear trend. We only call a direction when it passes a standard statistical test for trends and the change is at least 2 points a decade, about 5 points over the 24 years. Year-to-year swings are large, so "no clear trend" is the most common answer.
Open water is left out of every number on the card, because lakes and rivers read high on NRCan's maps and nobody farms or lends on a lake. The card reports the open-water share separately when it is 5% or more. A quarter that is mostly open water shows a short note instead of a score. Wetlands stay in, because flood-prone slough edges are part of the answer.
How to read it
NRCan intends these maps for patterns and trends at regional and national scales. In its own words, they are not meant for "predicting flooding at individual properties or supporting engineering or building design decisions." How much weight to give the layer depends on your use case:
- Screening a list of parcels: use it to flag which quarter sections sit in higher-susceptibility ground, then look closer at those first.
- Planning across a region: use it to compare river valleys, basins, and municipalities, where the 2000 to 2023 pattern is the signal.
- A decision about one property or structure: treat it as context only, and rely on provincial flood hazard maps and site-specific assessment.
Future scenarios
NRCan also publishes flood susceptibility under future climate conditions: 2050, 2070, and 2100, each under two emissions scenarios (SSP2-4.5 and SSP5-8.5). Township Canada does not show these for individual parcels yet, and here is why.
A climate signal should grow with time and be stronger under higher emissions. When we sampled 200 random locations across the Prairies, the future maps did neither:
- The typical value rose from 6 today to 39 in the future maps.
- At 77% of locations, every future scenario sat above that location's own highest value from 2000 to 2023.
- At 72% of locations, all six future maps returned the same value, and the higher-emissions scenario was no higher than the moderate one on balance.
NRCan's documentation notes that the future maps use temperature and precipitation, while the historic maps also use land cover and vegetation. A change in model inputs like that can shift the whole baseline, which would explain a single jump that does not change with the year or the scenario. On a parcel report, it would read as "flood susceptibility rises sixfold by 2050" almost everywhere, and we do not think that would be an honest reading. We will add the future scenarios to the report when they can be read with confidence.
Related
Related Articles
CLI Land Capability: the National Agricultural Baseline
The Canada Land Inventory classifies every cultivable parcel into seven capability classes. Township Canada uses it as the 30% capability component of the Productivity Score.
Canadian Drought Monitor: Current Drought-Severity Polygons
The Canadian Drought Monitor publishes monthly drought-severity polygons. Township Canada uses the current month to modify the Productivity Score and flag drought on every parcel.
Soil Landscapes of Canada: the National Soil Fallback
Soil Landscapes of Canada v3.2 is the national soil-order dataset. Township Canada uses it for soil context outside Alberta, where AGRASID does not reach.