By Township Canada
Harvest Crop Insurance Claims: How AFSC and SCIC Adjusters Verify Quarter Sections and Plan Field Routes
How crop insurance adjusters batch-convert hail and drought claim locations to GPS, verify storm path coverage on the map, and build efficient field inspection routes.
Harvest Crop Insurance Claims: How AFSC and SCIC Adjusters Verify Quarter Sections and Plan Field Routes
A hailstorm cuts through Township 48, Range 7, West of the 5th Meridian on a Thursday afternoon in late July. By Monday morning, an AFSC adjuster has 43 new claims on her desk. Each one lists a quarter section or LSD where canola, wheat, or barley took damage. She has until combining starts to get boots on every field, confirm the loss, and file her assessments.
The claims arrive as a spreadsheet: SW 22-048-07W5, NE 15-048-08W5, 14-33-049-07W5. Legal land descriptions, not GPS coordinates. Before she can plan a single day of driving, she needs to know where each parcel actually sits, whether the claimed locations line up with the storm's path, and what order to visit them in so she isn't doubling back across three townships on grid roads.
That is the harvest-season reality for crop insurance adjusters across the Prairies from July through October. Hail, drought, excess moisture, and early frost claims come in clusters, each one tied to a legal land description that needs to become a field inspection before the physical evidence is gone.
Forty Claims, One Week, and a Lot of Grid Road
The spring filing workflow is about accuracy on paper. Adjusters verify that the quarter sections on a policy match the fields a producer actually farms, before the March 31 (SCIC) or April 30 (AFSC) deadline. The pre-planting crop insurance guide covers that process in detail.
Harvest claims are a different problem. The descriptions on the policy are already verified. Now the adjuster needs to turn dozens of those descriptions into a field inspection plan, quickly, while the damaged crop is still standing. A canola field flattened by hail looks very different before and after the combine runs through it. Timing matters.
The typical workflow has three steps: convert the claim locations to GPS coordinates, verify the geographic pattern against the weather event, and build an inspection route. Each step depends on the one before it.
Building the Claims CSV
The starting point is the claim spreadsheet. Every AFSC or SCIC claim references the legal land description of the insured parcel. A batch of hail claims from the Peace Country might look like this:
claim_id,legal_land_description,crop,damage_type
HC-2026-4401,SW 22-048-07W5,canola,hail
HC-2026-4402,NE 15-048-08W5,wheat,hail
HC-2026-4403,14-33-049-07W5,barley,hail
HC-2026-4404,NW 08-048-07W5,canola,hail
HC-2026-4405,SE 16-048-07W5,wheat,hail
HC-2026-4406,NE 21-049-08W5,canola,hail
The third entry (14-33-049-07W5) is an LSD reference: Legal Subdivision 14 of Section 33, Township 49, Range 7, West of the 5th Meridian. That's a 40-acre parcel, more precise than a quarter section. Both formats convert the same way.
The batch converter accepts CSV files with a column named legal_land_description, lld, legal, location, or description. Extra columns (claim ID, crop type, damage type) pass through to the output, so the claim metadata stays attached to the coordinates.
Batch Conversion: From Descriptions to Coordinates
Upload the CSV to the batch converter. Township Canada processes each legal land description, calculates the GPS centre point from official survey coordinate data, and returns latitude and longitude for every record. A file with 200 claims converts in seconds.
Two things happen during conversion that matter for claims work. First, the converter flags any description that doesn't match a known parcel. A mistyped range number (W8 instead of W7) shows up as an error before the adjuster drives to the wrong location. Second, the output includes the boundary polygon for each parcel, not just the centre point. That boundary is what makes the next step possible.
Batch conversion requires a Business plan. For the full upload walkthrough, see the batch conversion guide.
Verifying Storm Path Coverage on the Map
After conversion, the claimed parcels appear as pins on the interactive map, plotted on the DLS survey grid over satellite imagery. This is where the adjuster's desk work pays off.
A hailstorm follows a path. The damaged parcels should form a geographic cluster consistent with that path. If 42 of the 43 claims fall in a tight northeast-to-southwest band across Townships 48 and 49, and one claim sits 80 km to the southeast with no neighbouring damage reports, that outlier deserves a closer look before committing a full day's drive.
The satellite imagery adds another layer. Hail damage on a canola field is visible from satellite within days of the event: the plants lose their upright structure and the field's reflectance changes. An adjuster can compare the satellite view against the DLS grid boundaries to see whether the physical damage aligns with the claimed quarter section. If a field shows damage on the east half but the claim is for the west quarter, that discrepancy is worth noting before the field visit.
This kind of screening doesn't replace an in-person inspection. It prioritises the inspection list. An adjuster with 43 claims and five working days can focus the first day on the straightforward cases (cluster of claims, visible damage, consistent with storm track) and hold the ambiguous ones for closer examination.
Planning an Efficient Inspection Route
With the claim locations plotted, the next question is what order to visit them. Forty-three sites spread across three townships means a lot of grid roads. Driving them in spreadsheet order, sorted by claim ID, almost guarantees backtracking.
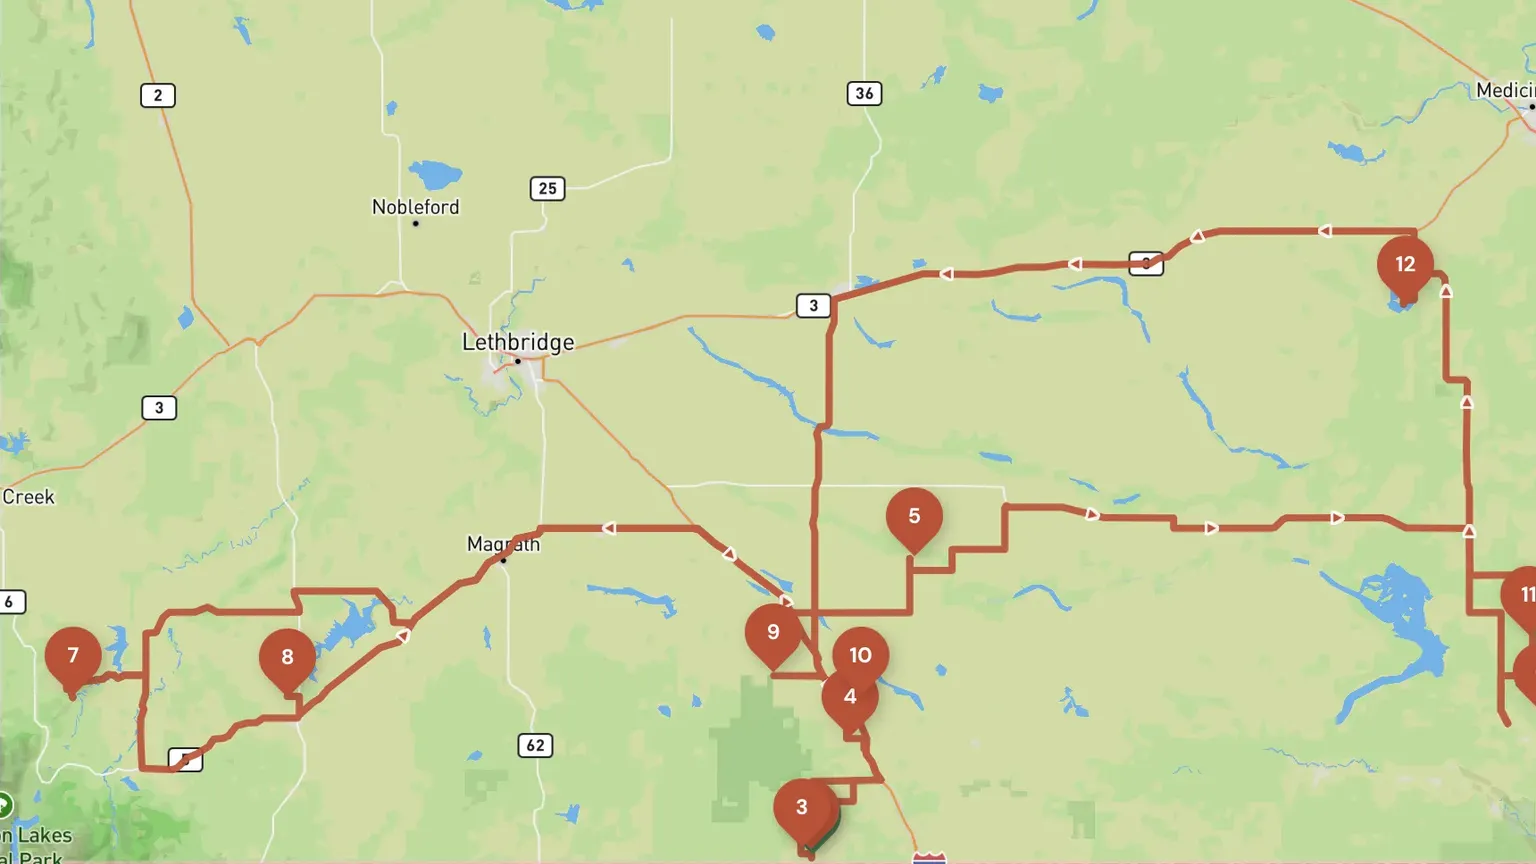
The route planner takes a set of converted locations and calculates the most efficient sequence of stops. The adjuster selects the day's inspection sites from the map, runs the optimization, and gets a route that minimizes driving time between parcels.
For a batch of 12 claims in two adjacent townships, the difference between an unoptimized drive and an optimized route can be 40 to 60 km of unnecessary grid road. Over a week of inspections, that adds up. Route optimization requires a Pro plan or higher, with 10 optimizations per month on Pro and unlimited on Business.
Saskatchewan: SCIC and Satellite Forage Claims
SCIC adjusters handling drought or forage insurance claims under Saskatchewan's satellite-based program should note a detail about township-level payouts. In the satellite forage program, payouts are calculated at the township level based on satellite-derived vegetation indices. Two adjacent quarter sections can receive different payouts if they fall in different townships.
The DLS system defines township boundaries, and a quarter section's township is encoded in its legal land description. SW 36-032-21W3 sits in Township 32, while NW 01-033-21W3, the next quarter section north, is in Township 33. If the township boundary runs through a producer's pasture, the claim amounts may differ by quarter section. The Saskatchewan satellite crop insurance guide covers the mechanics of how satellite-based claims interact with the DLS grid.
The Harvest Claims Workflow
The full process from desk to field comes down to three steps:
- Build a CSV from the claim spreadsheet with a legal land description column.
- Upload it to the batch converter to get GPS coordinates and boundary polygons for every claim.
- Plot the results on the map, verify the geographic pattern against the weather event, and run the route planner for each day's inspections.
Township Canada published a step-by-step harvest crop insurance how-to guide covering this workflow in detail, including a worked example using realistic coordinates from the Peace Country. The guide is live and in-season: harvest claims run from July through October across Alberta and Saskatchewan.
For the pre-planting side of the workflow (verifying policy descriptions before the spring deadlines), see the crop insurance legal land description guide.