By Township Canada
Flood Susceptibility on the Map: Screen Canadian Parcels Against NRCan's National Layer
NRCan's 30 m flood susceptibility map is now a Township Canada layer on every plan, drawn under the survey grid so you can read each quarter against it.
Say you adjust crop insurance claims in west-central Alberta, and a wet stretch has left you with a list of quarter sections in Township 48, Range 7, West of the 5th Meridian, the township just south of Drayton Valley. Before you book field days, you want to know which of those quarters sit on ground that tends to flood and which sit on upland. Until now, that meant opening Natural Resources Canada's flood viewer in one tab, finding each parcel by eye, and switching back to Township Canada for the legal land description.
Township Canada now carries NRCan's national flood susceptibility map as a layer, drawn under the survey grid. Turn it on, and the quarter sections and LSDs on your list sit directly on top of it.
What the flood susceptibility layer shows
NRCan's Flood Susceptibility Mapping estimates how likely land is to flood, based on where floods have happened before and on the conditions that tend to come with them: elevation, soil, land cover, vegetation, and seasonal weather. The layer we carry is NRCan's present-day estimate. It covers 2000 to 2023 at a 30 m resolution, across all of Canada.
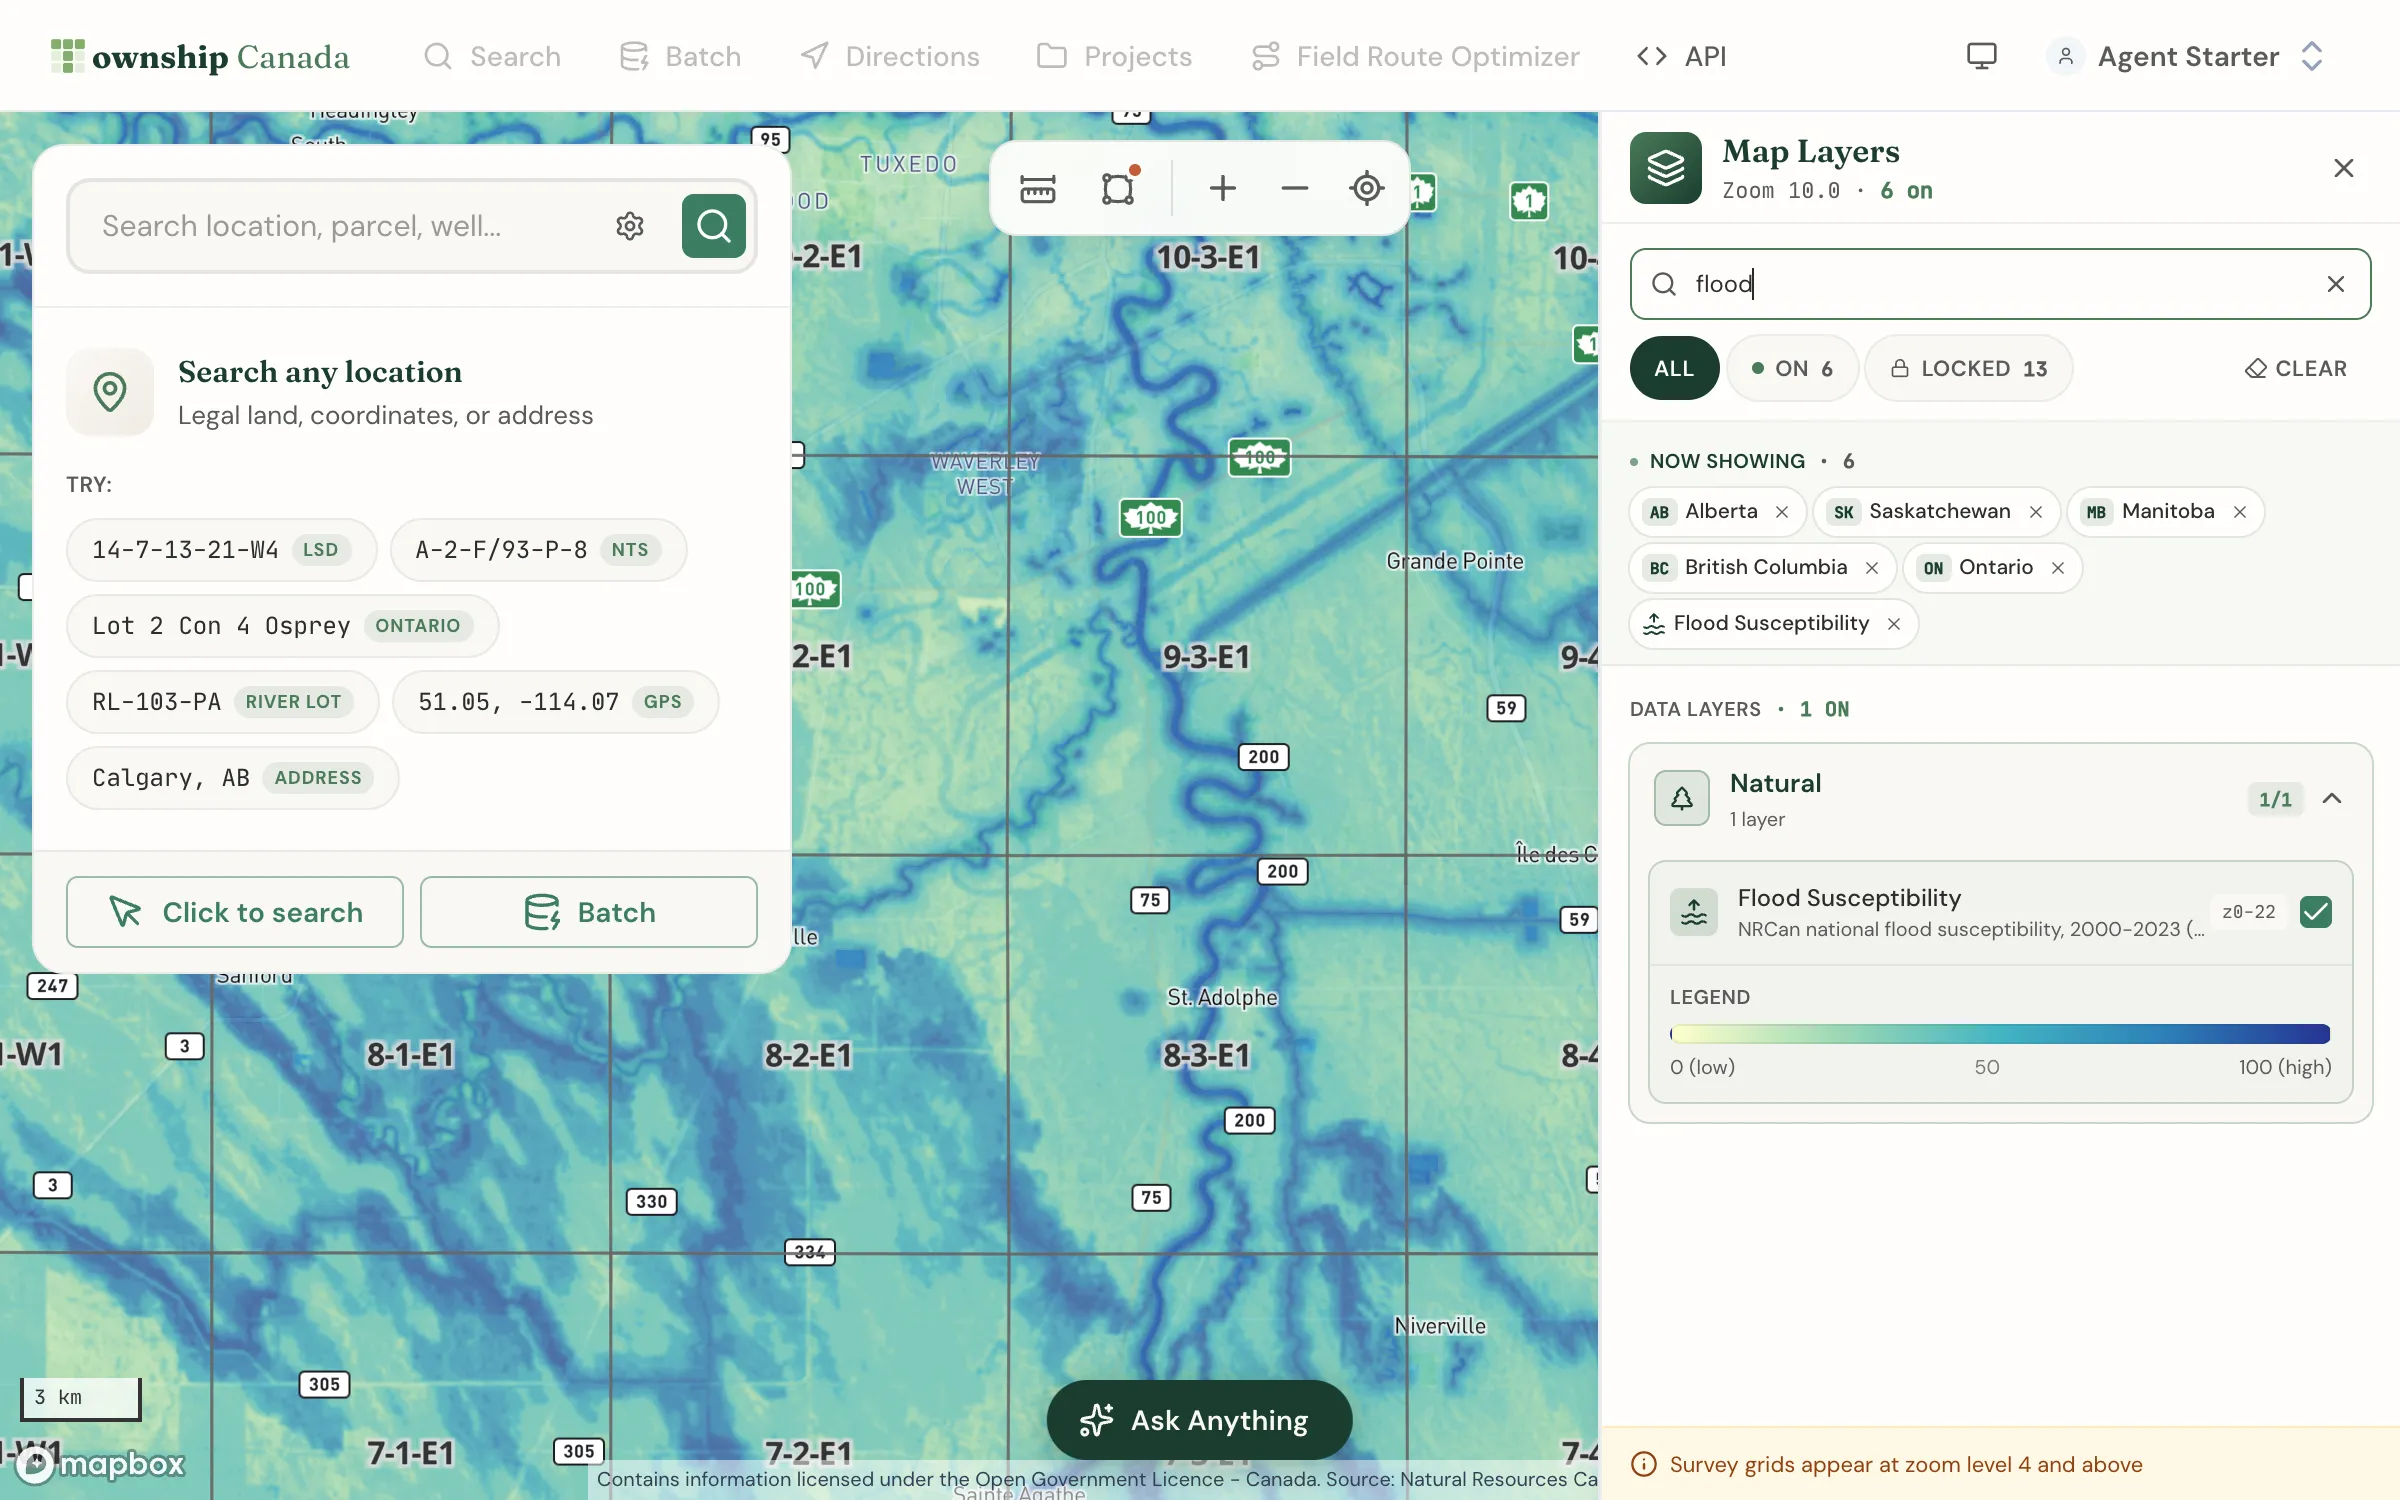
Every 30 m cell has one value from 0 to 100. A higher value means the land was more likely to flood in a given year over that period. NRCan publishes no classes or official cut-offs, so read it as a continuous scale. We draw the values unchanged in NRCan's own colour ramp: pale yellow for low values, through green and teal, to dark blue for high values. The legend in the Layers panel shows the same ramp.
Two points matter before you read it. First, lakes, rivers, and some nearshore water carry values too, and they usually read high. A dark blue band along a valley is often the river itself, so look at the land beside it. Second, NRCan built this map for regional patterns. Its documentation says the maps are not meant for predicting flooding at individual properties or for engineering and building design. For a decision about one structure, use the provincial flood hazard map and a site assessment.
Turn the layer on
- Open the map and click the Layers button in the bottom-right corner.
- In Data Layers, expand Natural.
- Turn on Flood Susceptibility.
You can also type "flood" in the Layers panel search box to jump straight to it. The layer draws from the national view down to street level, and it sits under the survey grid, so township, section, quarter, and LSD lines stay on top. It is included on every Township Canada plan, Starter included, with no add-on needed.
A satellite base map under the layer helps you tell a slough from a seeded field. HD satellite imagery is part of Pro and Business. The map layers guide covers base maps, the layer search, and the rest of the panel.
Reading one township in a few minutes
Back to Township 48, Range 7, W5. The North Saskatchewan River crosses the northern sections of the township. With the layer on, that is where the blue concentrates: along the river, and around a scattering of low, wet spots further south. Most of the township reads pale.
The numbers agree with that first look. When we summarise the same NRCan map by quarter section, with open water left out, 107 of the township's 144 quarters have no land scoring 50 or higher, and none has half or more of its land at 50 or above. Seven quarters have at least a tenth of their land at 50 or higher. The highest is NE-34-48-7-W5, on the river, where about a third of the land scores 50 or more. SW-16-48-7-W5, away from the river, comes next.
For an adjuster, that turns a list into an order of work. The quarters along the river and around the low spots go to the top of the field schedule. The quarters on pale ground can follow, depending on what each claim says. The layer does not tell you whether a field flooded this season. It tells you which fields sit on ground that has tended to flood, which is context for where to look first, not evidence of a loss.
The same layer, other questions
The layer is not specific to insurance. Anyone who works with rural land by legal land description can read it the same way:
- Farmland buyers and rural real estate agents can check whether a quarter on a listing borders low ground before a showing.
- Environmental consultants can mark river valleys and wet depressions early in a desktop screen, before the site visit.
- Oil and gas land teams can see whether a proposed surface lease or access road sits in a valley bottom.
In each case, the value is the same: one map, the survey grid on top, and no second viewer to keep in sync.
When you need acres instead of colours
The map answers "where." For "how much" on one quarter section in Alberta, Saskatchewan, or Manitoba, the Agriculture Bundle's parcel report adds a flood card. It shows the acres of land scoring 50 or higher today, the spread across four bands in the same colours as the layer, the year-by-year history from 2000 to 2023 with the highest years named, and whether the trend is rising. The quarter figures for Township 48 above come from those summaries. The Agriculture add-on guide explains what the bundle includes, and pricing lists the plans it stacks on.
For how NRCan built the map, and why we do not show its 2050 to 2100 climate scenarios for individual parcels yet, read the NRCan flood susceptibility data guide. If claims are your line of work, legal land descriptions for insurance covers how insurers and adjusters use DLS and LSD descriptions for claims and coverage mapping.