By Township Canada
What's behind the map: a documentation page for every Energy and Agriculture layer
All 19 layers in the Energy Bundle (12) and Agriculture Bundle (7) now have a dedicated source page: publisher, attributes, refresh cadence, attribution, and where the layer lands on the map and the parcel report.
A land technician working a surface lease review in southeast Alberta needs four browser tabs and an FTP client to assemble the picture. AER OneStop for the ST37 well list. A second AER portal for ST76 pipelines. Petrinex for last year's production volumes. The AGRASID viewer if the agronomy team wants soil context on the same parcel. Each portal has its own refresh schedule, its own attribution boilerplate, and its own definition of "current." Pull SE-32-48-7-W5, paste the coordinates around, hope nobody published a revision between yesterday and the morning meeting.
The Energy Bundle and Agriculture Bundle were built to collapse that into one search. The new piece - and the reason we're posting today - is that every dataset behind those bundles now has its own documentation page, so you can see exactly where each layer comes from before you trust it on a filing.
19 layers, 19 pages
Township Canada's data-source index now publishes a dedicated page for every layer in the Energy Bundle (12 layers) and the Agriculture Bundle (7 layers). Each page is short on purpose. Four questions, in the same order, every time:
- What it is - the formal name, the publisher, what it's the authoritative register for.
- What it carries - the actual field names, geometry types, and codes you get back.
- Coverage and refresh - which provinces, how many records, and on what schedule we re-ingest it.
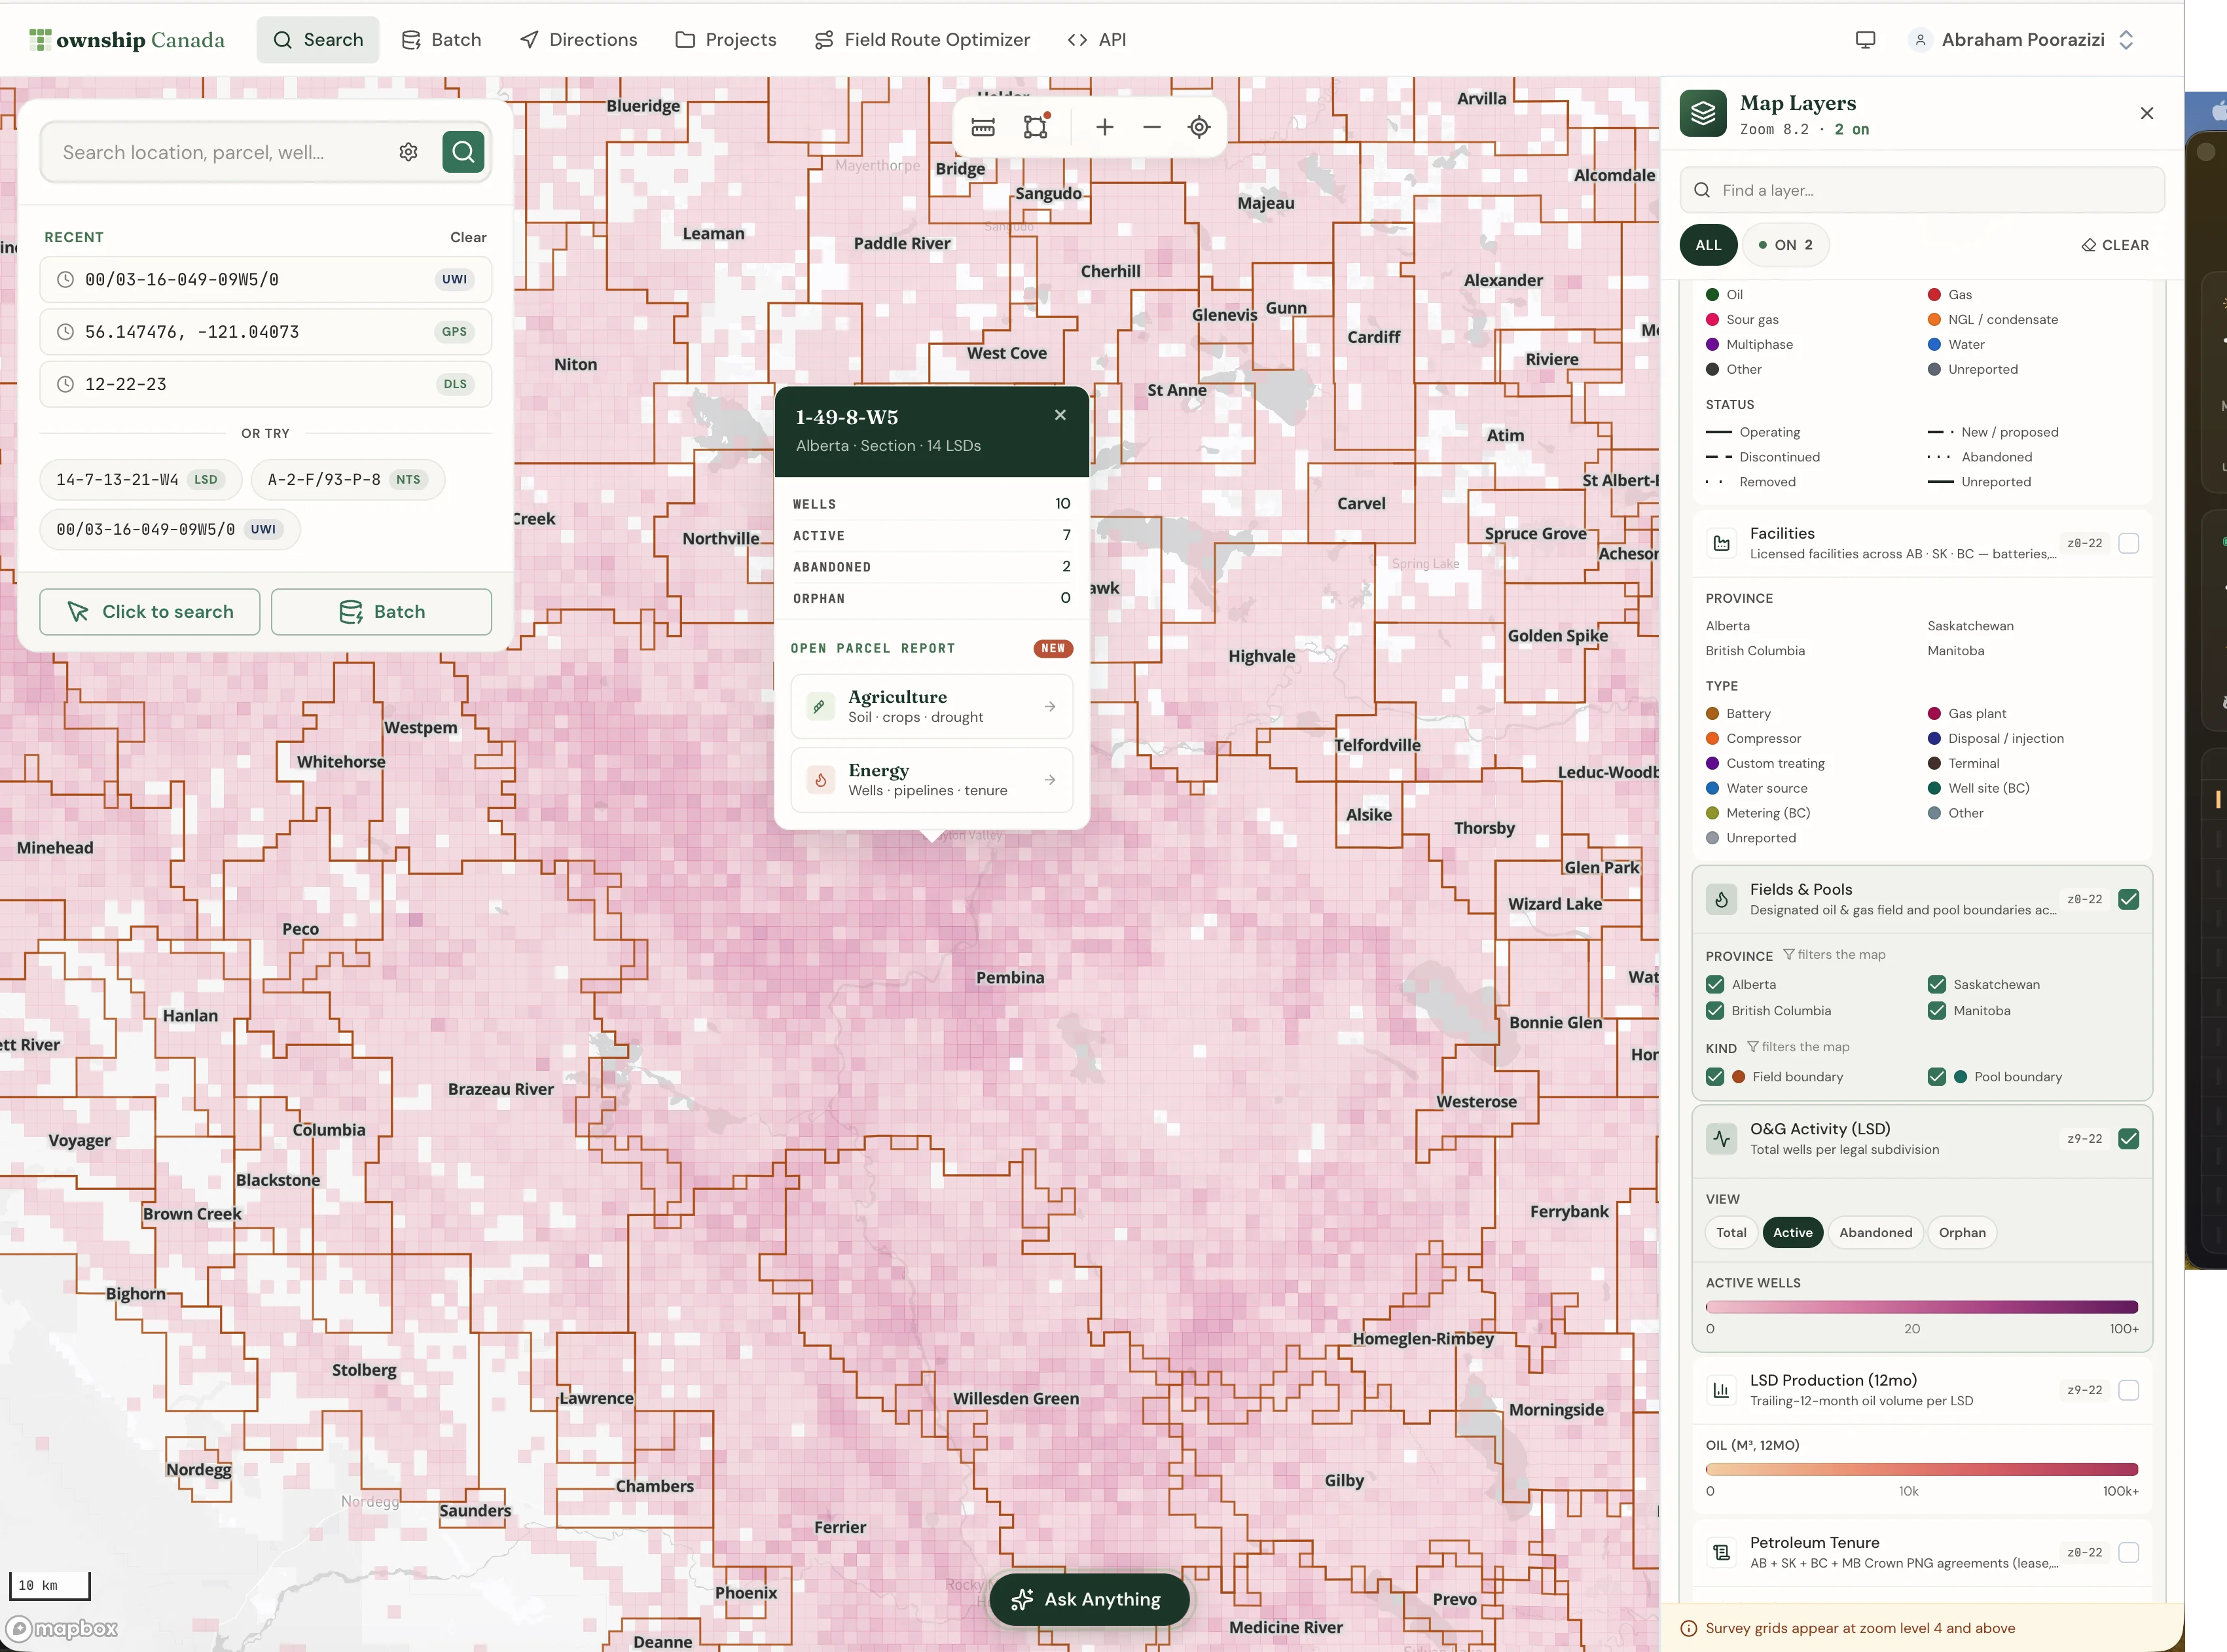
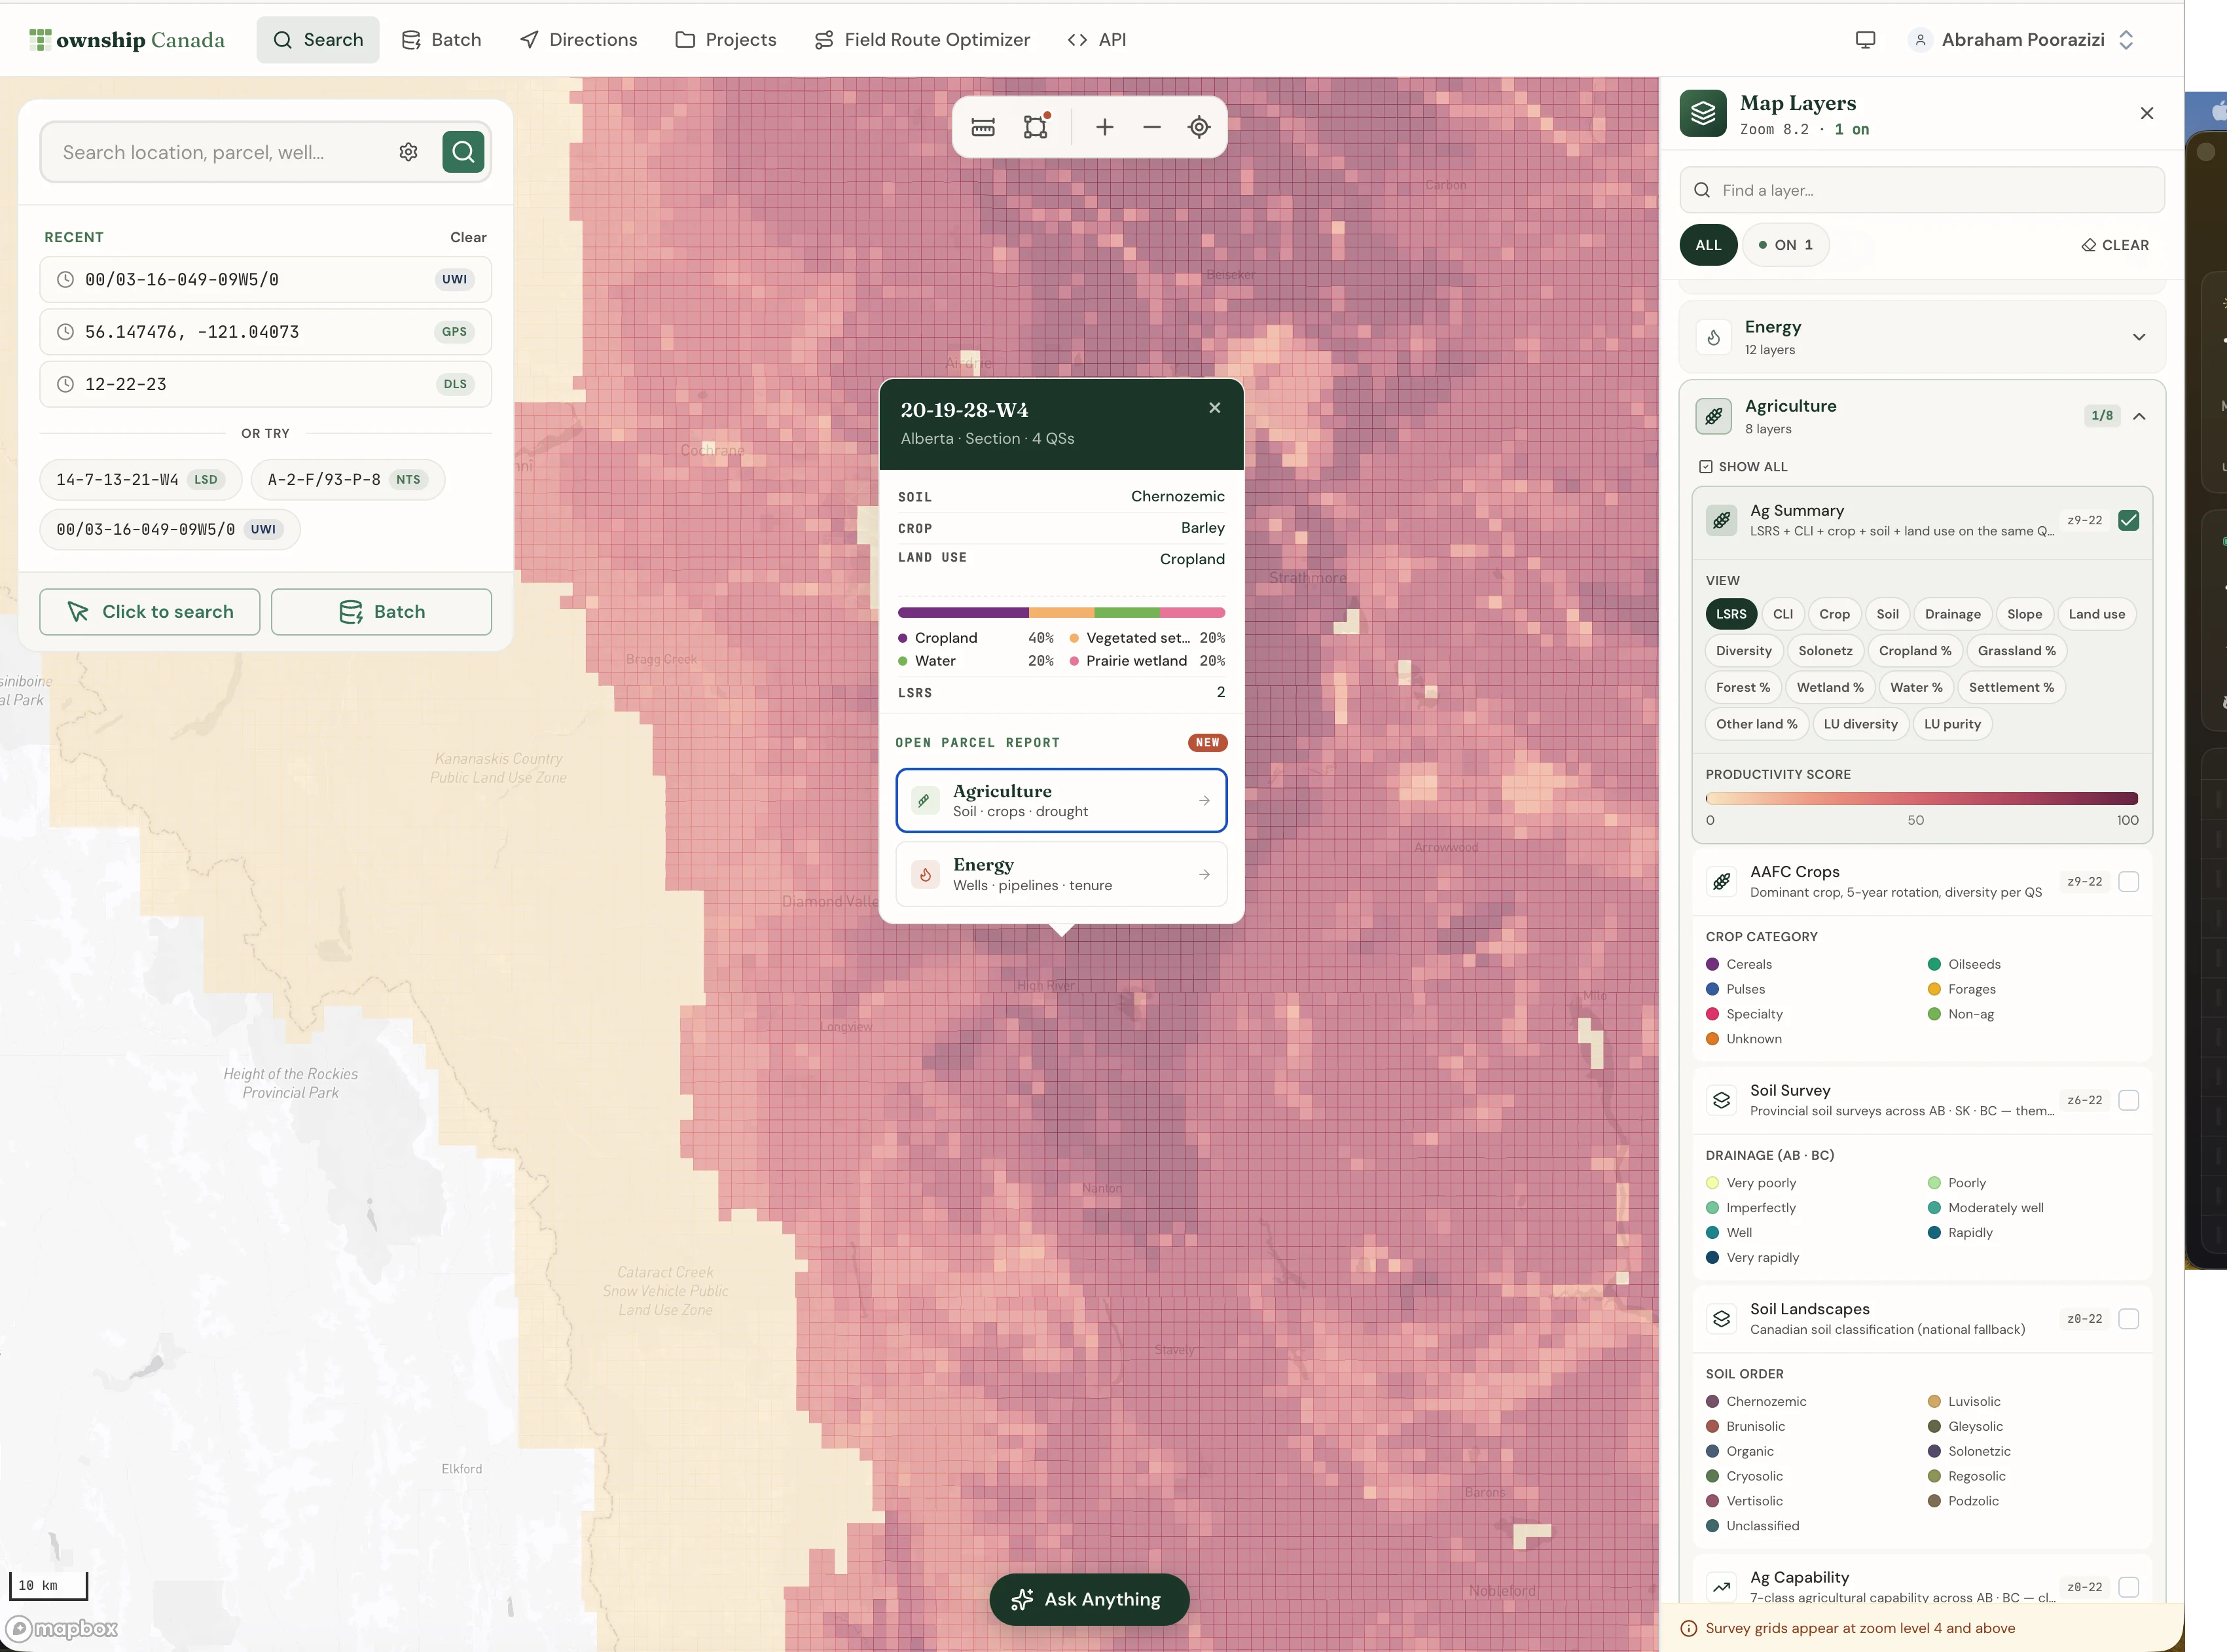
- How Township Canada shows it - which map layer it powers and which parcel-report tab it lands in, with a screenshot.
That structure exists because the question we get most often from new bundle subscribers isn't "can you do X" - it's "where did this number come from, and when was it last refreshed?" The data-source pages answer both before you have to ask.
Energy Bundle: the four layers you'll touch first
All 12 Energy Bundle layers now have a source page. Four are worth walking through because they cover the most common workflows:
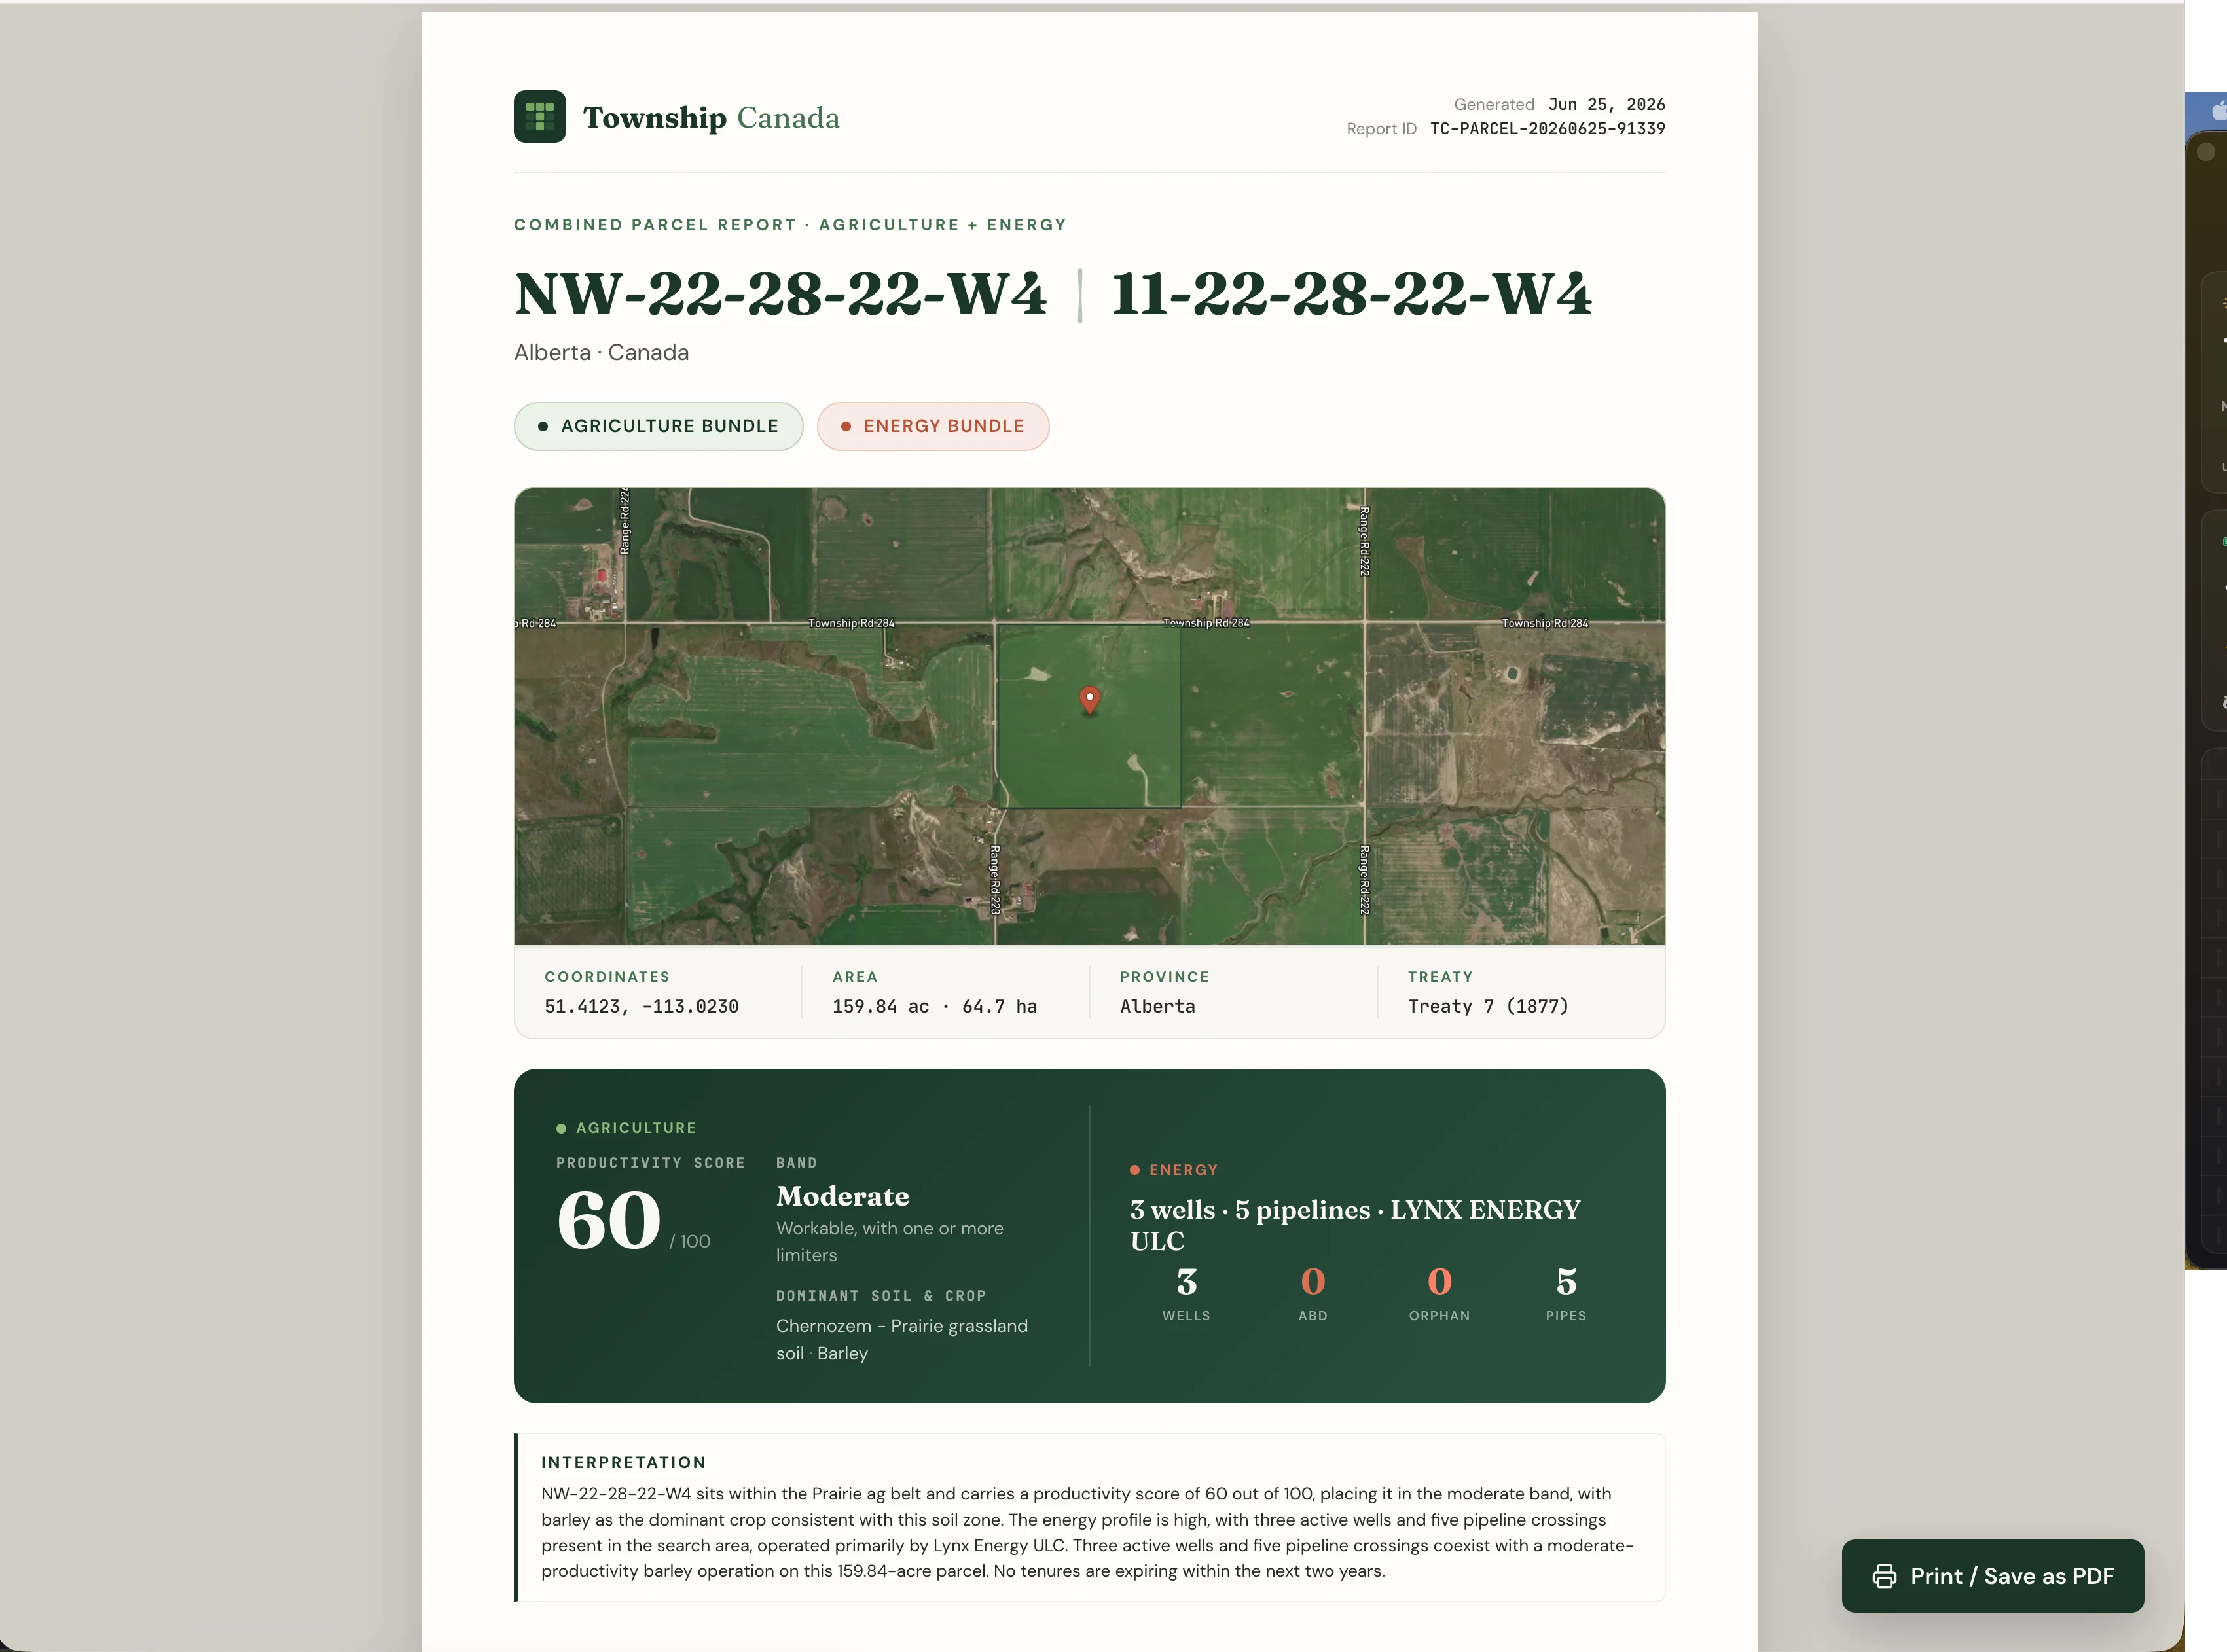
AER ST37 wells. The Alberta Energy Regulator's complete List of Wells. Every record carries a UWI, licence number, current lifecycle status (active, suspended, abandoned, reclaimed, orphan), operator BA code, fluid, mode, and surface coordinates. The page is explicit: more than 530,000 wells, refreshed monthly. When you pull NE-14-32-21-W4 in a parcel report and see two wells listed, the ST37 page is what tells you those two wells have been reconciled against AER's open data within the last 30 days, not at some unspecified point.
Petrinex volumetrics. Per-well, per-product production volumes for Alberta and Saskatchewan via Petrinex, and BC via BCER (iris.bcogc.ca): oil, gas, water, condensate, and the smaller streams (CO2, helium, nitrogen). Township Canada keeps the well-level detail and computes Legal Subdivision rollups with a dominant product and producing-well count. The page documents what redistribution is permitted under Petrinex's public terms, which matters if you're embedding these numbers into a client deck or a reserves discussion.
CCS pore-space tenure. Carbon-capture-and-storage tenure is an emerging dataset, so the page is honest about it: coverage grows as Alberta grants new sequestration hubs, rather than being a fixed register. Each record carries the feature type (pore-space agreement, project boundary, or injection well), operator, status, area, and effective and expiry dates. For carbon developers preparing AER tenure proposals, the page links straight to the Crown PNG tenure page so you can cross-check overlapping conventional rights on the same Legal Subdivision.
Oil and gas fields. Named field and pool boundary polygons for Alberta, BC, and Saskatchewan. This is the context layer: the one that turns a list of wells into "those three wells are in the Pembina Cardium pool, and the operator holds the adjacent block." The page makes clear it's drawn from three separate provincial regulators (AER, BCER, and Saskatchewan's energy regulator), which is exactly the kind of provenance detail you want documented when an M&A team asks where a boundary came from.
Agriculture Bundle: three layers that drive a real decision
Three of the seven Agriculture Bundle layers carry most of the decision weight:
AGRASID 4.1 and LSRS. Alberta's authoritative soil-polygon dataset, and the source of the federal-provincial Land Suitability Rating System productivity score on a 0–100 scale. The page documents what each polygon carries (subgroup, drainage, parent material, slope, salinity) and which factor was the limiter that capped the score. Around 380,000 Alberta quarter sections carry an LSRS score, refreshed annually each June. For an appraiser writing a justification narrative on SW-7-13-21-W4, that limiter ("moisture deficit" or "pattern" or "continuous cropping") is the sentence that goes into the report.
AAFC Annual Crop Inventory. Agriculture and Agri-Food Canada's satellite-derived crop classification, published every January for the prior growing season. Township Canada samples it per quarter section and builds a five-year rotation, dominant crop, and Shannon diversity index. Coverage is more than 1.7 million Prairie quarter sections across AB, SK, and MB. The page notes the colour table on our map matches AAFC's published colours, a small detail that matters when a client recognizes the legend from their existing AAFC viewer workflow.
Canadian Drought Monitor. Monthly drought-severity polygons on the standard D0–D4 scale, intersected with the quarter section to produce both the current drought class and a modifier that nudges the productivity score down in proportion to severity. The page documents the exact multipliers (D0 leaves the score unchanged; D4 multiplies it by 0.85), which is the kind of explicit methodology a crop-insurance adjuster will want to cite.
Where the pages live
Three entry points, depending on how you got here:
- The full catalog: /learn/data-sources - every layer indexed, with a one-line summary.
- Industry pages: /industries/oil-and-gas and /industries/agriculture now link each data card directly to its detail page. Click a layer name in the data catalog and you land on its source page rather than a sales pitch.
- Two new feature guides: Map Layers control and Parcel Report Sidebar, both added this week. The guides index is now 35 entries.
The pattern across all 19 pages is the same: short, structured, honest about coverage and refresh, and explicit about attribution. If a layer covers Alberta only, the page says so. If a dataset is emerging and grows over time rather than being fixed, the page says that too.

Browse the data-source catalog to see the full set, or pull a parcel report on any Alberta quarter section to see the layers in context. Both the Energy and Agriculture Bundles are add-ons available on Pro and Business (see /pricing for plan detail).