By Township Canada
Ag Tiles API and Energy Tiles API: Render Agriculture and Energy Map Layers in Your Own Application
Two new tile APIs let developers render Township Canada's agriculture and energy map layers inside their own MapLibre or Mapbox GL JS applications, authenticated with an API key.
A farmland evaluation map needs more than a basemap and parcel boundaries. Soil productivity and crop rotation layers give buyers context about the land they are comparing. The data exists: AGRASID soil polygons in Alberta, the AAFC Annual Crop Inventory nationally, CLI capability classes across the Prairies. But serving it means sourcing each dataset, converting it to vector tiles, hosting those tiles on a CDN, and keeping everything current as agencies publish updates. That is not a map feature. That is an infrastructure project.
The same problem appears on the energy side. A field operations tool needs to show AER wells, pipeline routes, and Crown tenure boundaries on a map so a landman can see what surrounds a prospect parcel. Each dataset comes from a different regulator, in a different format, on a different refresh cycle.
Township Canada now offers two tile APIs that solve both problems: the Ag Tiles API and the Energy Tiles API. They serve the same PMTiles-backed vector tile layers that power the Agriculture Bundle and Energy Bundle map layers in the Township Canada web app, available to any developer via API key authentication.
How they work
Both APIs serve Mapbox Vector Tiles (MVT) from maps.townshipcanada.com. The Ag Tiles API serves from /ag/, the Energy Tiles API from /energy/. Authentication uses the same ?api_key= query parameter as the existing Maps API, and keys are managed from the same developer portal.
Each API exposes a set of tile archives. An archive is a single tileset: one PMTiles file behind a standard {z}/{x}/{y}.mvt URL. Every archive also publishes a TileJSON endpoint (append .json to the archive path) that returns the bounding box, zoom range, and available source layers, so your map client can configure itself.
The Ag Tiles API serves 18 archives. The Energy Tiles API serves 12. Fields and pools are available in the web app, but are not included in the published Energy Tiles API archive list.
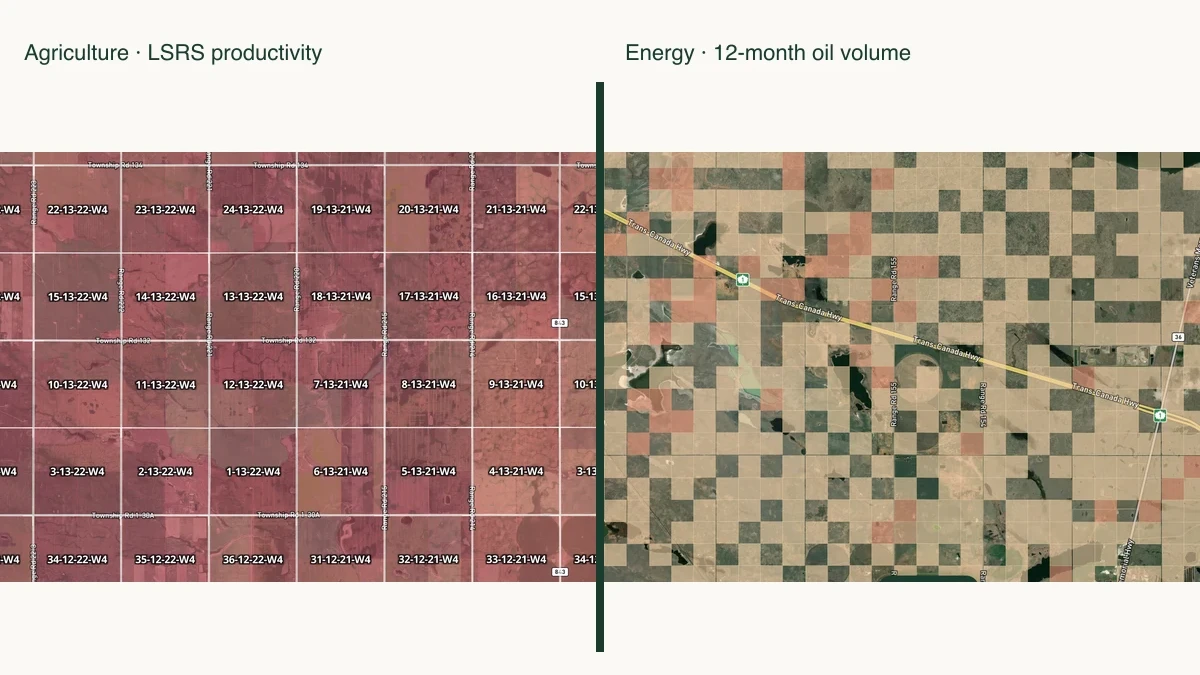
Real map views of Agriculture LSRS productivity (left) and Energy 12-month oil production (right), captured September 29, 2026. The shared tile data is shown with the web app’s styling.
Adding a layer to a MapLibre map
Here is the practical version of "three lines of config." To render the agriculture summary layer (soil productivity, crop type, and capability in one tileset) on a MapLibre GL JS map, add one source and one layer:
const KEY = "YOUR_API_KEY";
const base = "https://maps.townshipcanada.com/ag";

map.addSource("ag-summary-qs", {
  type: "vector",
  tiles: [`${base}/ag_summary_qs/{z}/{x}/{y}.mvt?api_key=${KEY}`],
  minzoom: 9,
  maxzoom: 14
});

map.addLayer({
  id: "ag-summary-fill",
  type: "fill",
  source: "ag-summary-qs",
  "source-layer": "ag_summary",
  minzoom: 9,
  paint: { "fill-color": "#41ab5d", "fill-opacity": 0.6 }
});
That renders quarter-section polygons coloured by agriculture data from zoom 9 onward. At higher zoom levels you see individual quarter sections; at lower zoom levels the detail would be too dense. This is where the zoom-banded rollup families come in.
Zoom-banded rollup families
Several layers ship as three archives at different spatial grains: township, section, and quarter-section (or LSD for energy layers). The agriculture summary, for example, comes as ag_summary_twp (zoom 0 to 6), ag_summary_sec (zoom 6 to 9), and ag_summary_qs (zoom 9 to 14). All three share the same source-layer name (ag_summary), so your styling rules apply at every zoom. Add all three sources and layers with their respective zoom ranges, and the map transitions from township-level aggregates to individual quarter sections as the user zooms in:
map.addSource("ag-summary-twp", {
  type: "vector",
  tiles: [`${base}/ag_summary_twp/{z}/{x}/{y}.mvt?api_key=${KEY}`],
  minzoom: 0,
  maxzoom: 6
});
map.addSource("ag-summary-sec", {
  type: "vector",
  tiles: [`${base}/ag_summary_sec/{z}/{x}/{y}.mvt?api_key=${KEY}`],
  minzoom: 6,
  maxzoom: 9
});
map.addSource("ag-summary-qs", {
  type: "vector",
  tiles: [`${base}/ag_summary_qs/{z}/{x}/{y}.mvt?api_key=${KEY}`],
  minzoom: 9,
  maxzoom: 14
});
Each source gets a matching layer with the same source-layer: 'ag_summary' and the same paint rules. The result is a map that stays informative from a provincial overview down to individual parcels, without loading quarter-section geometry when the user is looking at all of Alberta.
The same pattern applies to the energy side. Well activity (og_activity_twp, og_activity_sec, og_activity_lsd) and production (lsd_production_12mo_twp, lsd_production_12mo_sec, lsd_production_12mo) each ship as three zoom-banded archives.
Available layers
Ag Tiles API (18 archives)
The agriculture archives cover soil, crop, capability, and land-use data across western Canada:
- Ag Summary (3 archives, zoom-banded): combined soil productivity, crop type, and capability per parcel. The primary layer for a farmland evaluation map.
- AAFC Crop Summary (3 archives, zoom-banded): crop inventory from AAFC's Annual Crop Inventory, with dominant crop and rotation data.
- Soils: unified soil survey polygons from Alberta AGRASID, the Saskatchewan provincial survey, and the BC soil survey.
- LSRS Productivity (3 archives, zoom-banded): LSRS productivity scores for Alberta quarter sections, derived from AGRASID 4.1 and AAFC's Land Suitability Rating System.
- BC Agricultural Capability: the 7-class agricultural capability rating for British Columbia parcels.
- Saskatchewan Crown Land (with labels): Saskatchewan Crown agricultural land parcels.
- Saskatchewan Pastures (with labels): community pastures in Saskatchewan.
- BC Agricultural Land Reserve (with labels): BC ALR boundaries.
- BC Freshwater Atlas Wetlands: wetland polygons from BC's Freshwater Atlas.
Energy Tiles API (12 archives)
The energy archives cover wells, pipelines, facilities, production, and tenure:
- OG Activity (3 archives, zoom-banded): well activity summary per parcel, with counts by status (active, suspended, abandoned, orphan).
- Production (3 archives, zoom-banded): trailing 12-month oil and gas production volumes.
- Pipelines: pipeline routes across Alberta, Saskatchewan, and British Columbia.
- Facilities (with labels): AER-registered facilities (batteries, compressors, gas plants, injection stations, meter stations).
- Petroleum Tenure: Crown PNG (petroleum and natural gas) dispositions with status and expiry.
- Mineral Tenure (with labels): Crown mineral dispositions (metallic, coal, ammonite).
For the complete list of source-layer names, properties, and zoom ranges, use the TileJSON endpoint for any archive: https://maps.townshipcanada.com/ag/{archive}.json?api_key=YOUR_API_KEY or https://maps.townshipcanada.com/energy/{archive}.json?api_key=YOUR_API_KEY.
Pricing
Both tile APIs share the same pricing structure. Tile volumes are higher than the report APIs because a single map pan can request dozens of tiles:
| Tier | Price (CAD) | Tiles/month |
|---|---|---|
| Build | $50/mo | 10,000 |
| Scale | $250/mo | 100,000 |
| Enterprise | $1,250/mo | 1,000,000 |
Build fits prototyping and internal dashboards with a small number of users. At 10,000 tiles per month, a developer building a proof-of-concept soil-productivity map or a well-screening overlay has room to iterate.
Scale fits production applications with moderate traffic. A farmland listing platform that renders agriculture layers for a few hundred daily users, or a field operations tool that shows energy layers for a regional team, lands here.
Enterprise fits applications with broad usage. An agri-tech platform serving hundreds of farm management clients, or an energy data service embedding well and pipeline layers across its product suite, gets a million tiles per month.
Each tile API is a separate subscription. If your application needs both agriculture and energy layers, subscribe to both. There is no combined tile discount: the Ag Tiles API and Energy Tiles API are independent products, separate from the Ag API and Energy API (which return structured parcel report data as JSON) and from the web app's Agriculture and Energy Bundles.
How these relate to the existing APIs
Township Canada's developer portal now includes eight APIs. The Search API, Autocomplete API, Batch API, and Maps API convert and locate. The Ag API and Energy API return structured parcel report data. The Ag Tiles API and Energy Tiles API render: they serve the same map layers that power the Township Canada web app, ready to paint onto your own map.
If you are building a full-featured land data application, you can combine them. Use the Maps API for the DLS survey grid, the Ag Tiles API for soil and crop layers, and the Ag API for detailed parcel reports when a user clicks a parcel. All APIs share the same API key management and authenticate the same way.
Getting started
- Create an API key in your account settings if you do not already have one.
- Subscribe to the Ag Tiles API, the Energy Tiles API, or both from the developer portal.
- Add a source and layer to your MapLibre GL JS map using the tile URL pattern shown above.
The TileJSON endpoint for any archive returns the bounding box, min/max zoom, and source-layer names, so your map client can configure itself without hardcoded values. Start with one archive, confirm it renders, and add layers from there.
For background on the datasets behind these tile layers, including where each one comes from and how often it refreshes, see What's Behind the Map: Township Canada's Energy and Agriculture Data Sources.