By Township Canada
See what's growing and what's underground: introducing the Agriculture and Energy bundles
Two new add-ons put farmland productivity, soil, crop history, wells, pipelines, and Crown tenure on every quarter section across the western provinces - in one report and on one map, with a defensible PDF you can hand to a client.
Update (2026): Coverage now extends beyond Alberta into Saskatchewan, BC, and Manitoba, and the Energy Bundle adds Crown mineral tenure (metallic, coal, ammonite) on the map and in the parcel report, alongside PNG dispositions.
For nine years, Township Canada has been the fastest way to turn a legal land description into a point on a map. Type NW-7-13-21-W4, get coordinates, see the parcel. Done.
But finding the parcel was never the hard part. The hard part was everything that came next. What's the soil like? What's been grown on it? Are there wells on it? Who operates them? Is the Crown lease about to expire? Answering those questions meant leaving us and opening AER GeoView, the AGRASID soil viewer, AAFC's crop inventory, the Orphan Well registry, and a stack of Petrinex spreadsheets - then stitching the answers together by hand.
Today that ends. Two new bundles put the full picture on the parcel you already searched for. The Agriculture Bundle tells you what's growing. The Energy Bundle tells you what's underground. Same map, same search box - now with the data that actually drives a decision.
One search, the whole story
Search any quarter section and you get a report with three tabs: an Overview, an Agriculture tab, and an Energy tab. One PDF button turns it into a document you can send to a client, attach to a file, or bring to a negotiation.
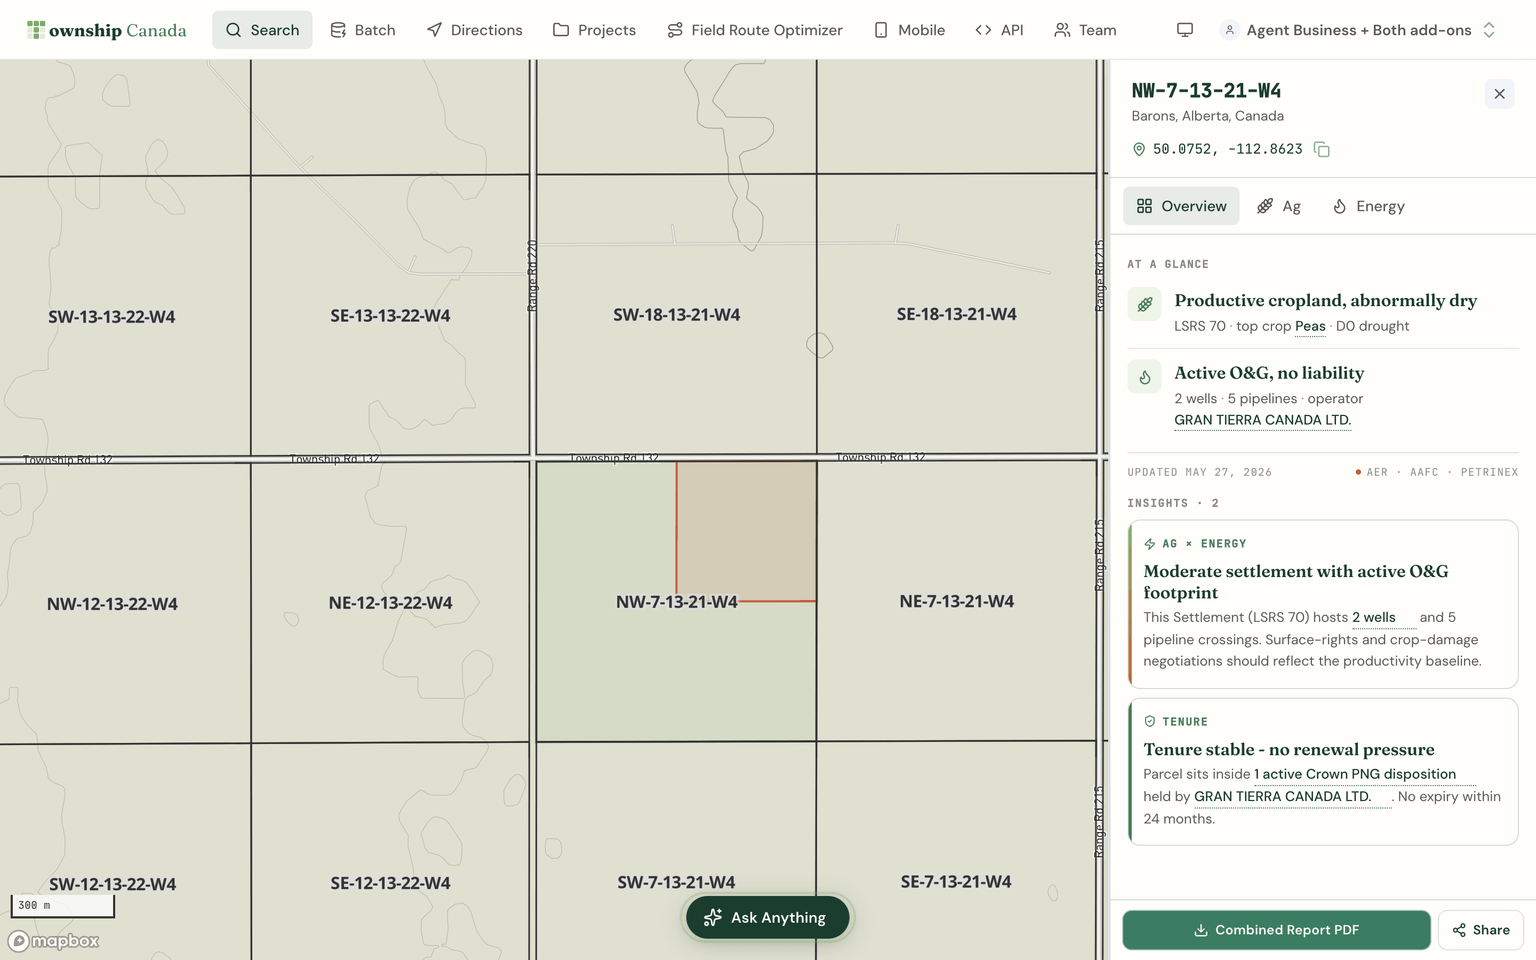
The Overview is the thirty-second read. Two plain-English headlines summarize the parcel - "Productive cropland, abnormally dry" and "Active O&G, no liability" - and a short set of insights connects the two: this quarter section hosts 2 wells and 5 pipeline crossings; surface-rights and crop-damage negotiations should reflect the productivity baseline. That sentence is the kind of thing a landman and an agronomist would each only know half of. Now it's on one screen.
What's growing
The Agriculture tab opens with a single number every appraiser, lender, and farmland investor already trusts: the productivity score: a 0-100 reading we build from AAFC's Land Suitability Rating System, the national suitability rating for spring-cereal cropland. We compute it per quarter section, then adjust it for current drought conditions and show you the one factor holding the parcel back.
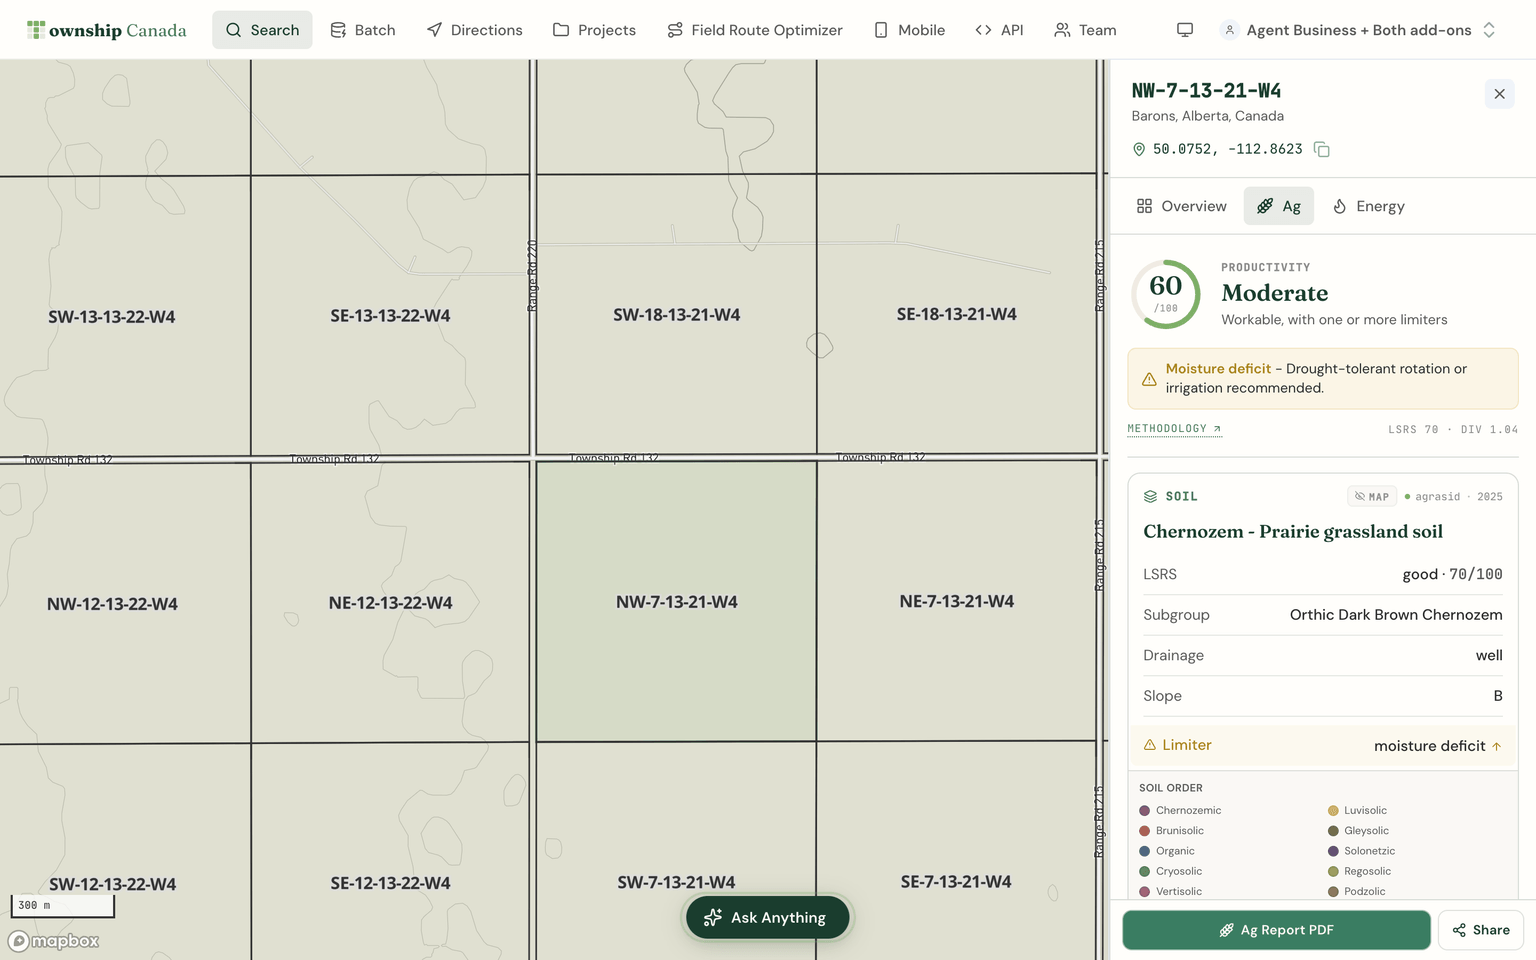
Below the score, the parcel's full agronomic profile: soil subgroup (an Orthic Dark Brown Chernozem, here), drainage, slope, and the limiter capping the score - moisture deficit, in this case. Then the five-year crop rotation, the dominant crop, and a diversity index. It's the difference between "160 acres near Barons" and "160 acres of Dark Brown Chernozem that's grown a peas-spring wheat-lentils rotation and is running dry this year." One of those you can price.
The productivity score is Alberta-only today, built on AGRASID 4.1 and AAFC's LSRS, with Saskatchewan on the roadmap. British Columbia has its own 7-class agricultural capability rating - a different scale, so we keep the two separate rather than blend them. Detailed provincial soil surveys cover Alberta, Saskatchewan, and BC; where a parcel falls outside them, the soil context still travels with you on AAFC's Soil Landscapes of Canada. Crop and land-use layers cover the Prairies and BC.
What's underground
The Energy tab is the analyst's view of the same parcel. How many wells, and are they active, abandoned, or orphaned. How much pipeline crosses the quarter. Which facilities sit on it. Which Crown PNG or mineral agreements overlap the LSD, and when they expire. And who the operator is - with a one-click jump to that company's full footprint: active, abandoned, orphan, and reclaimed counts across their entire AER portfolio.
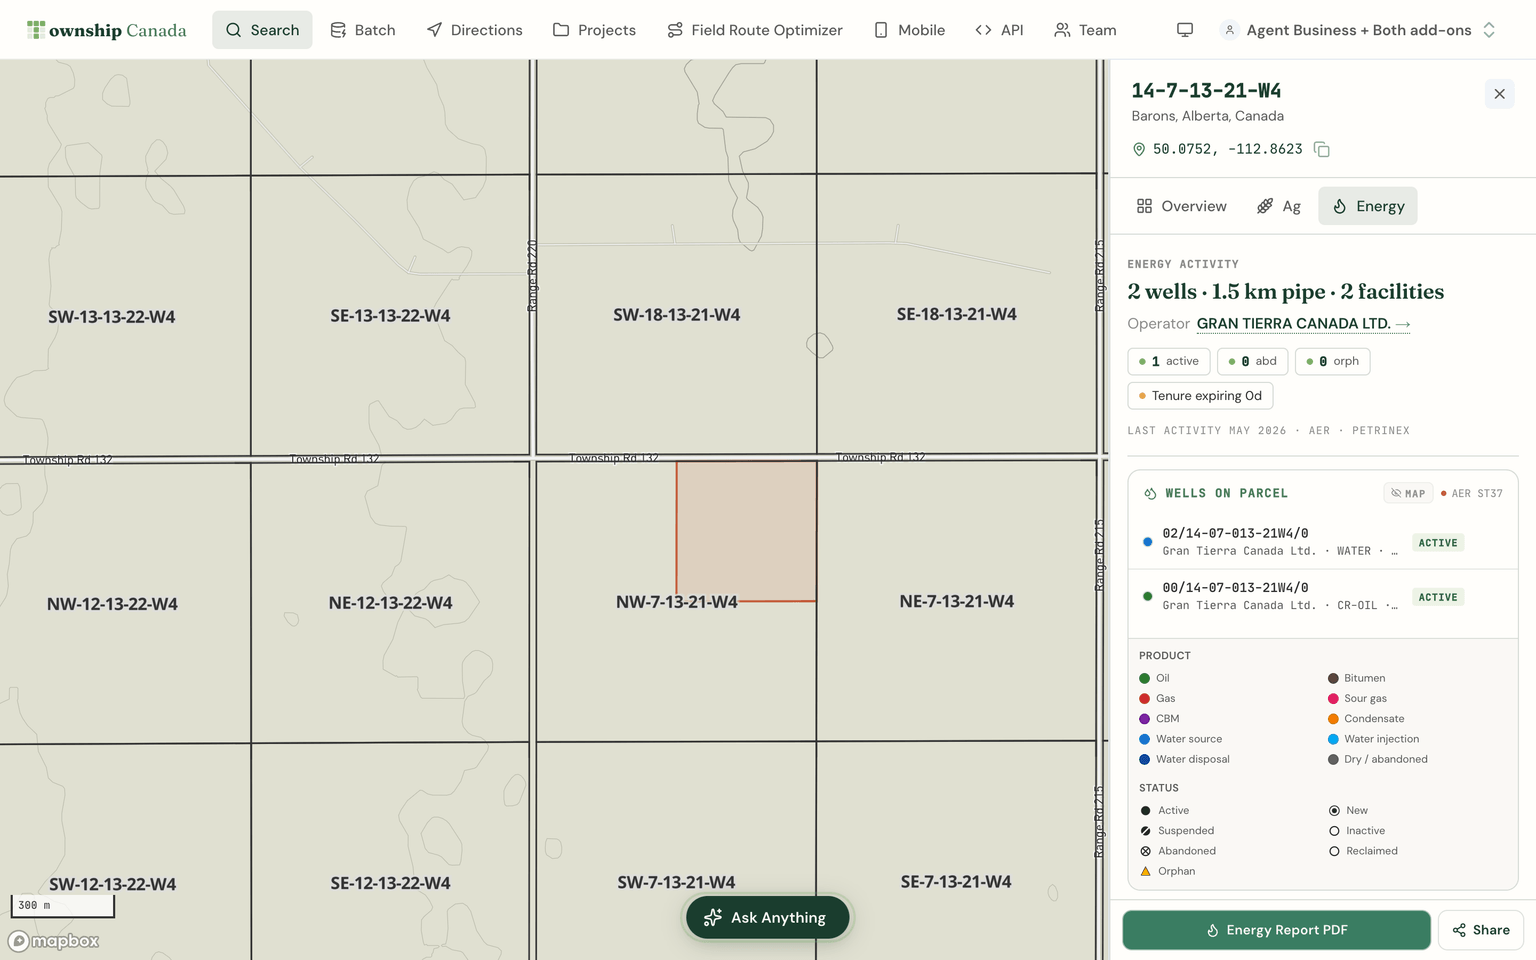
Each well is listed individually - UWI, operator, what it produces (oil, gas, water, condensate, sour gas), and its current status. A timestamp at the top tells you exactly when the data was last refreshed, drawn from the AER and Petrinex. For a surface-rights holder, that's the answer to "what's actually on my land?" For an M&A team, it's liability exposure before the term sheet.
This now reaches well beyond Alberta. Wells and Crown tenure - both PNG and mineral - cover Alberta, Saskatchewan, BC, and Manitoba; pipelines, facilities, and production cover Alberta, Saskatchewan, and BC. Where a province publishes less, the report reflects it honestly: Saskatchewan PNG agreements carry no expiry date, Manitoba has no public production feed, and BC tenure falls back to the disposition number where the holder isn't published.
See it across a whole township
The report answers one parcel. The map answers a region. Every dataset behind the report is also a layer you can paint across the grid - so you can spot the pattern, not just the point.
Where the production is. Color the grid by trailing-12-month oil volume and the producing quarters light up while the dead ground stays clear. This is how you screen an acquisition or pick the parcels worth a closer look.
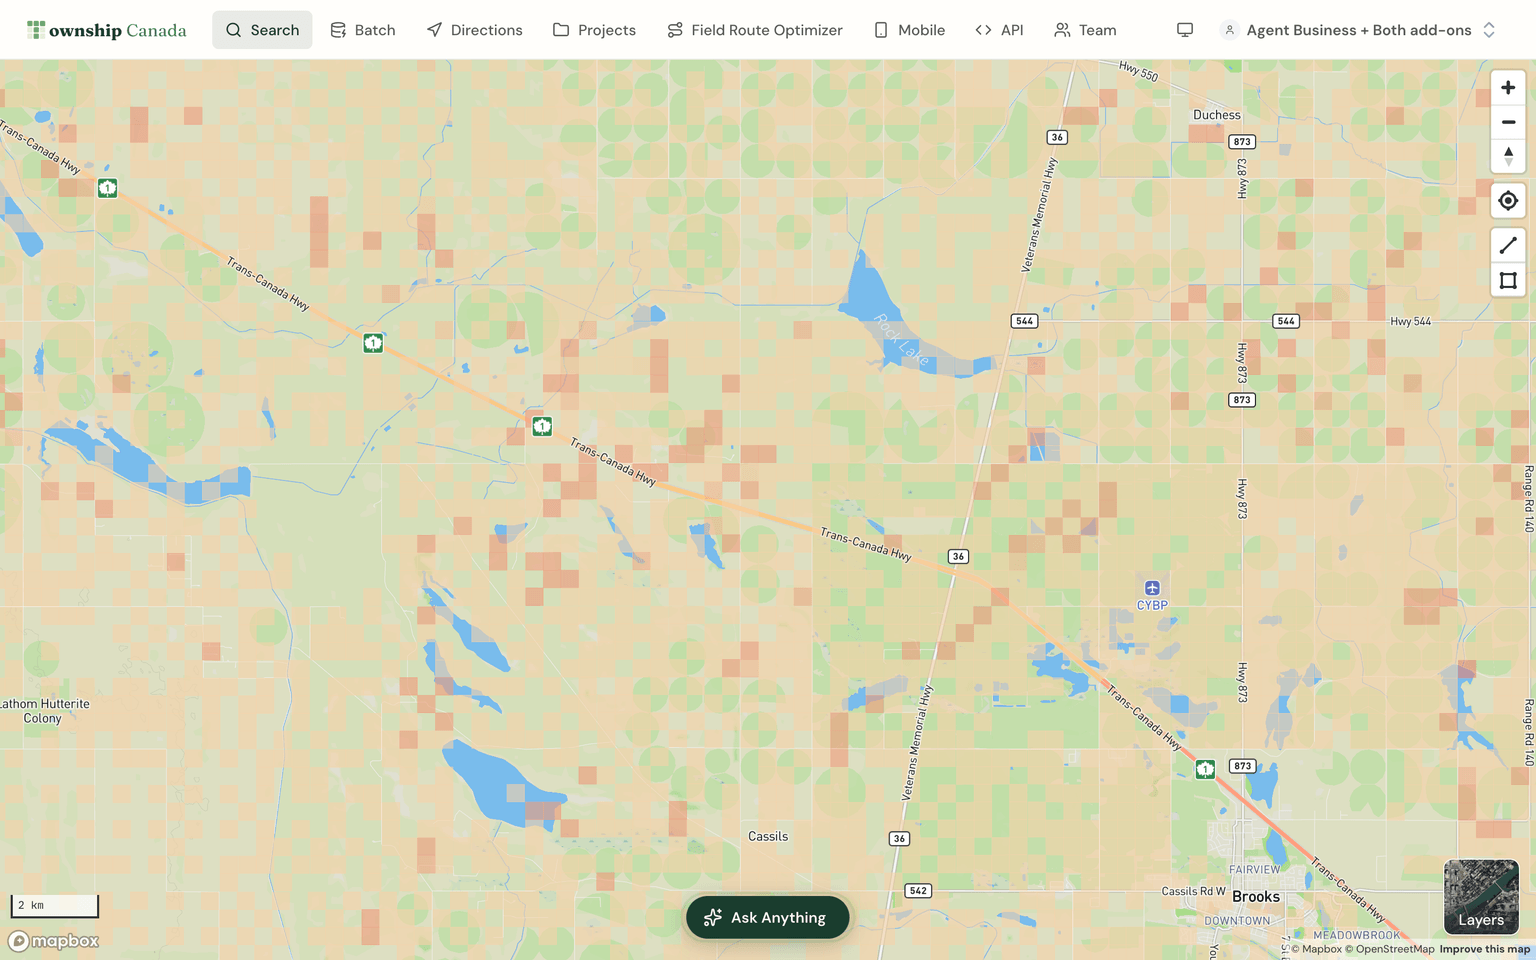
What's about to expire. Color the grid by Crown tenure expiry: PNG and mineral dispositions in one view, stable holdings in one shade and renewals inside their window in another. For a land team, this single view replaces the renewal spreadsheet that gets emailed around twice a quarter.
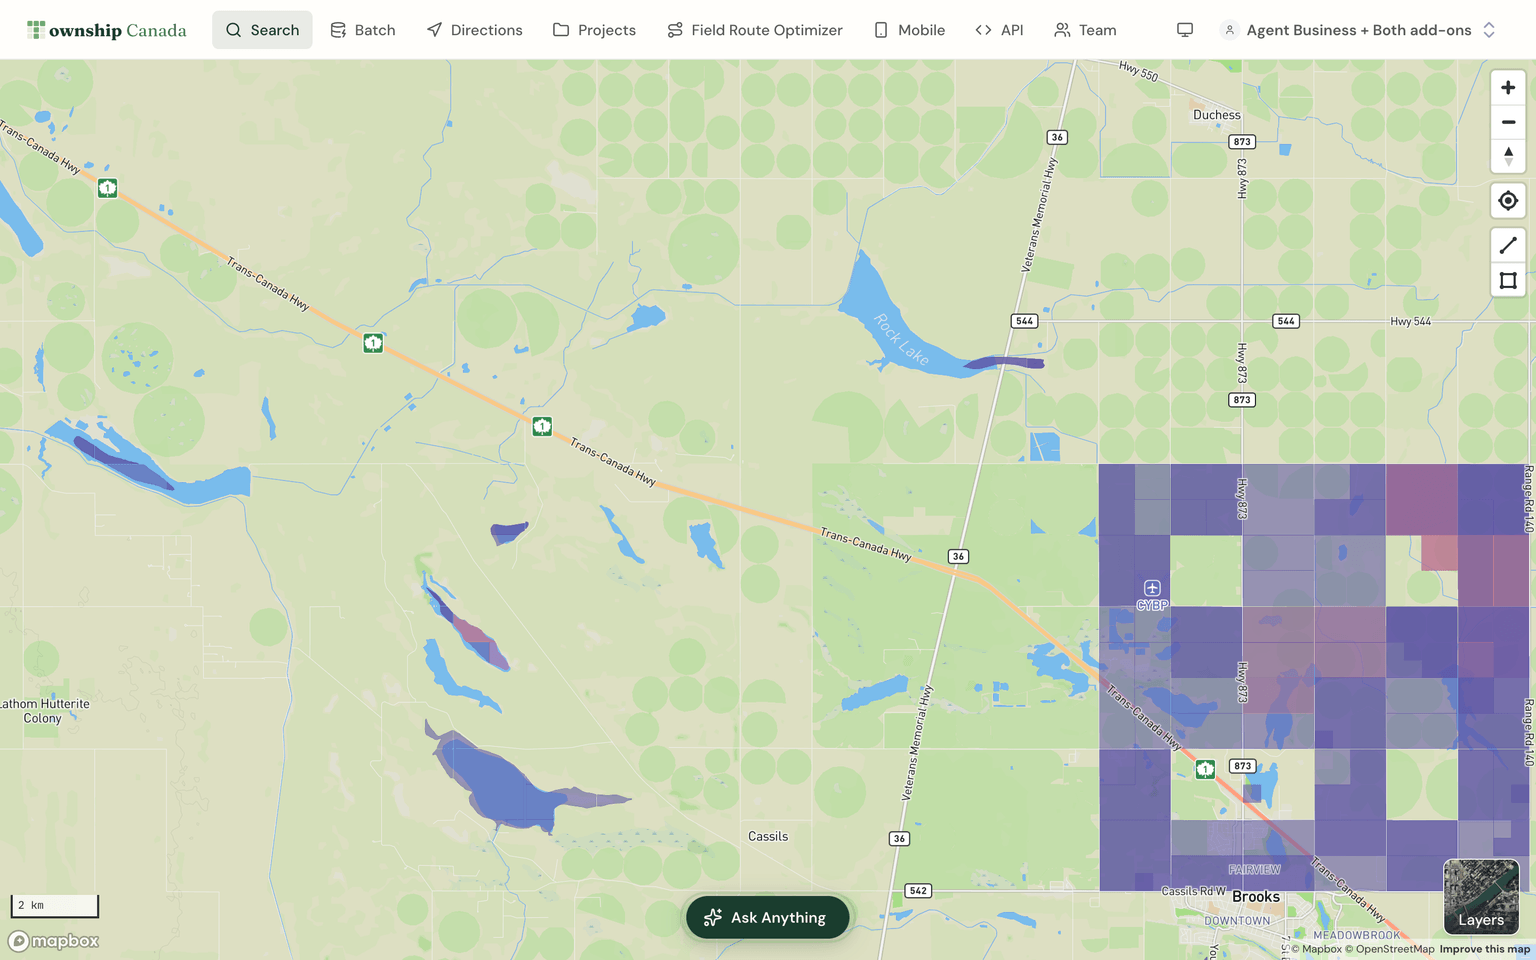
Mineral commodities. Switch to the minerals preset to theme metallic leases by target substance: uranium, iron, gold, and more, plus coal and ammonite shell tenure.
There's a liability view for orphan-well density, a productivity view for farmland, soil-survey and crop overlays, pipelines, facilities, and land layers like Saskatchewan Crown land and the BC Agricultural Land Reserve - every layer toggles from the same control, over the same DLS grid you've always used.
Who it's for
Farmland appraisers and ag lenders. Productivity score, soil, and rotation per quarter, in a defensible PDF for the appraisal file or the loan package. Stress-test collateral before the money goes out.
Farmers and farmland investors. Check a lease or a listing before you sign - soil, recent rotation, drought exposure, and whether there's energy activity that affects your use of the surface.
Oil and gas operators and land agents. Wells, pipelines, facilities, and tenure on one map. Prioritize expiring leases, target acquisitions, and plan field work without three portals open.
Surface-rights holders. One report that shows the productivity of your land and the energy activity on it - the document for a compensation conversation.
M&A and diligence teams. Operator footprints, orphan and abandoned exposure, production rollups, and tenure renewal pressure - the picture you need before you commit.
Pricing
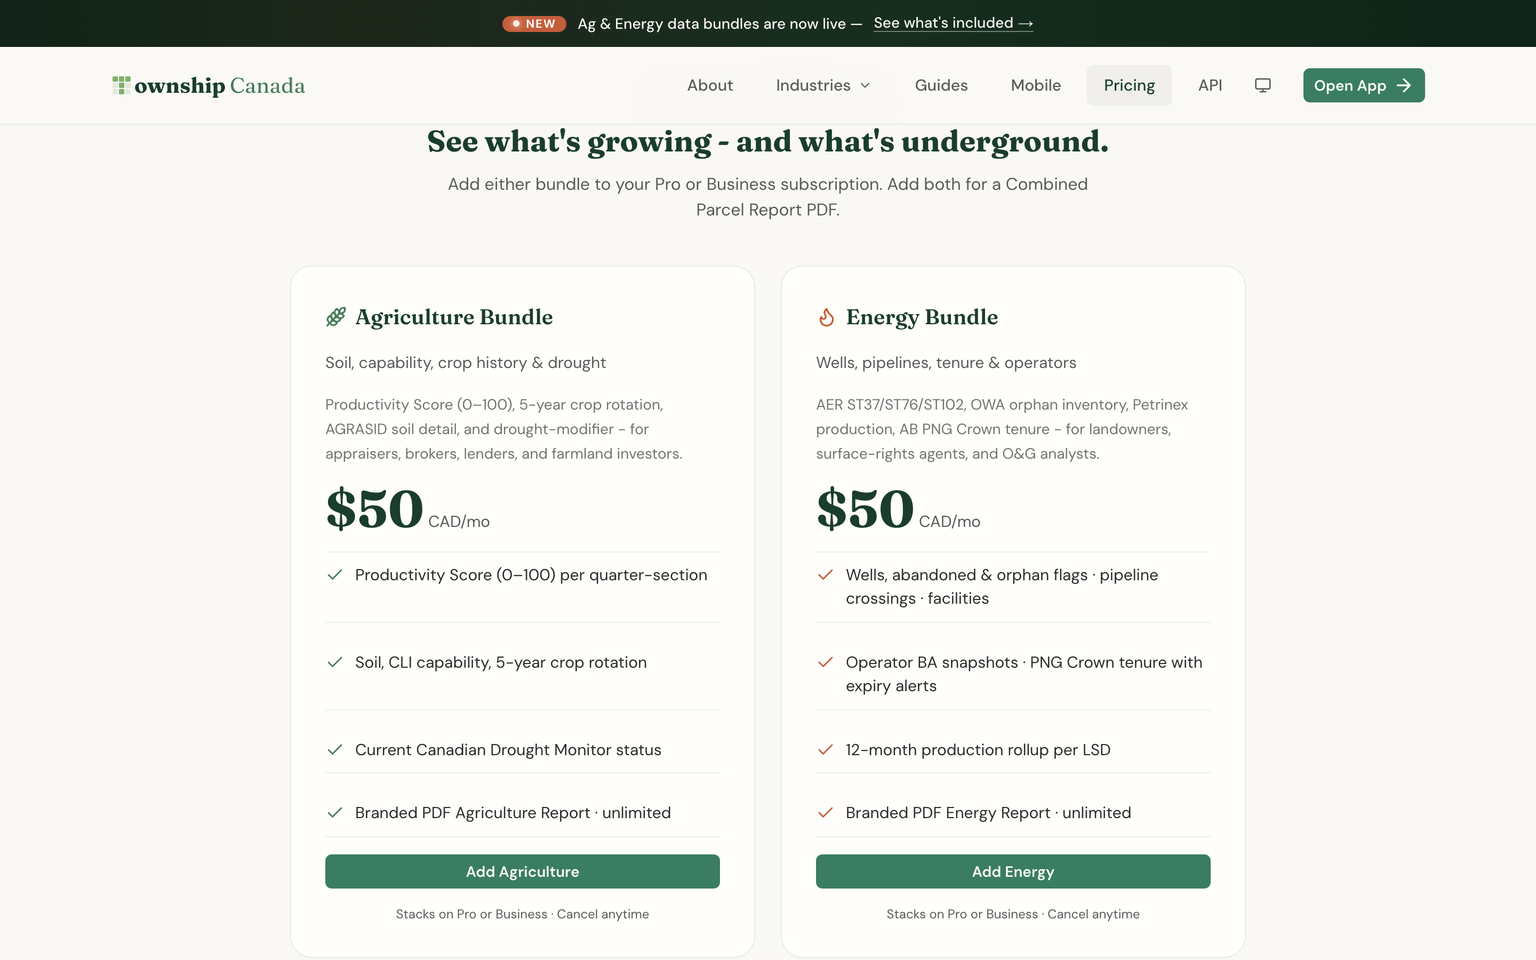
Both bundles stack on a Pro or Business plan (see pricing). Add one, or add both:
- Agriculture Bundle - productivity score, soil, capability, five-year crop history, drought, and unlimited branded Agriculture PDFs.
- Energy Bundle - wells, pipelines, facilities, operator snapshots, Crown PNG and mineral tenure with expiry alerts, production, and unlimited branded Energy PDFs.
- Add both and your report becomes a Combined Parcel Report - agriculture and energy in one PDF, the deliverable for any cross-domain conversation.
Already on Pro or Business? You get one free parcel report to see exactly what you'd be buying - run it on a quarter section you actually care about.
What's coming
This is the foundation, and we're already building on it: Saskatchewan and Manitoba productivity scores (Alberta is live today), and a portfolio manager for tracking owned, leased, and prospect parcels with renewal alerts. The datasets that power both bundles refresh on a schedule - weekly for Crown tenure, monthly for energy activity and drought, annually for soil and crop - so the report you pull next quarter reflects the ground as it is, not as it was.
Try it
The fastest way to understand the bundles is to run a report on a parcel you know. Try 14-7-13-21-W4 near Barons, Alberta - two wells and productive cropland on the same quarter - or paste your own legal land description into the search box.
Add the Agriculture Bundle, the Energy Bundle, or both from your account. They attach to your existing plan in a single step, and you can cancel any time.