By Township Canada
See the Rock Under an Alberta Well: 3D and 2D Subsurface Views
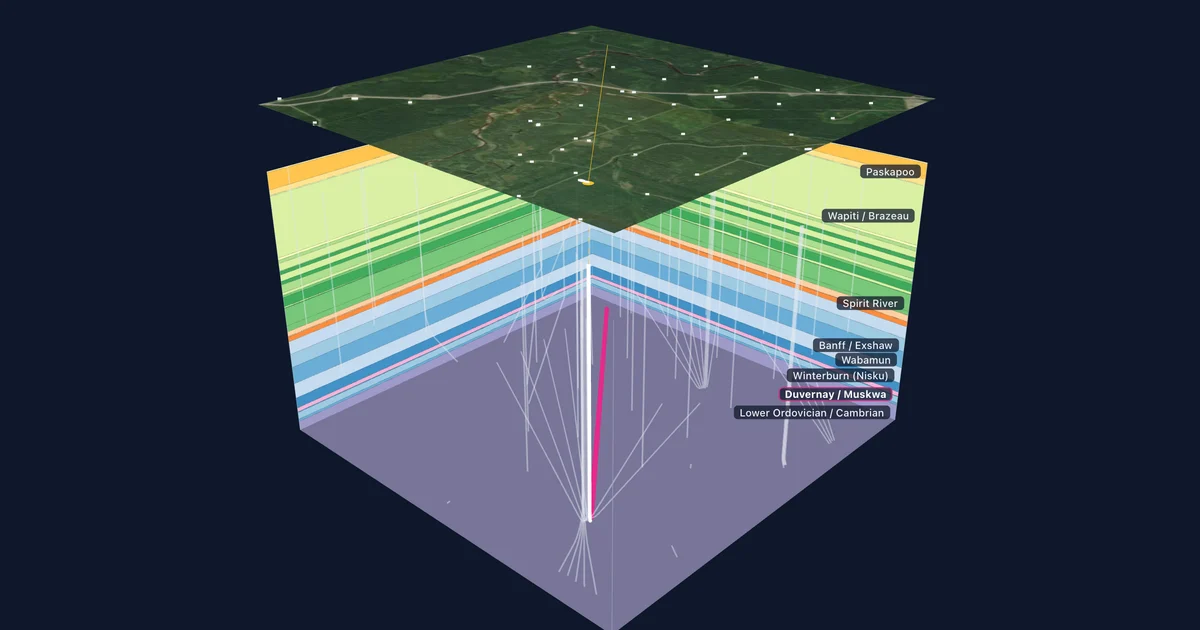
Alberta wells in Township Canada now open with a 3D block and a 2D section of the formations around them, built from the Alberta Geological Survey's provincial model, with the producing zone traced along the well path.
Open well 00/12-23-062-21W5/0 near Kaybob, Alberta, and the well detail gives you the facts on file: a horizontal well (the HZ in its name), a total depth of 8,925 m, a kelly bushing 852 m above sea level, and gas production over the last year. What the card could not show until now is the ground the well passes through. A total depth of 8,925 m is the length of the hole, not how deep it goes. Most of that length runs sideways through one formation more than 3 km down.
With the Energy add-on, every Alberta well now has a Subsurface card that draws that picture. It shows the rock formations around the well, the path the well takes through them, and the formation it produces from.
Two views of the same rock
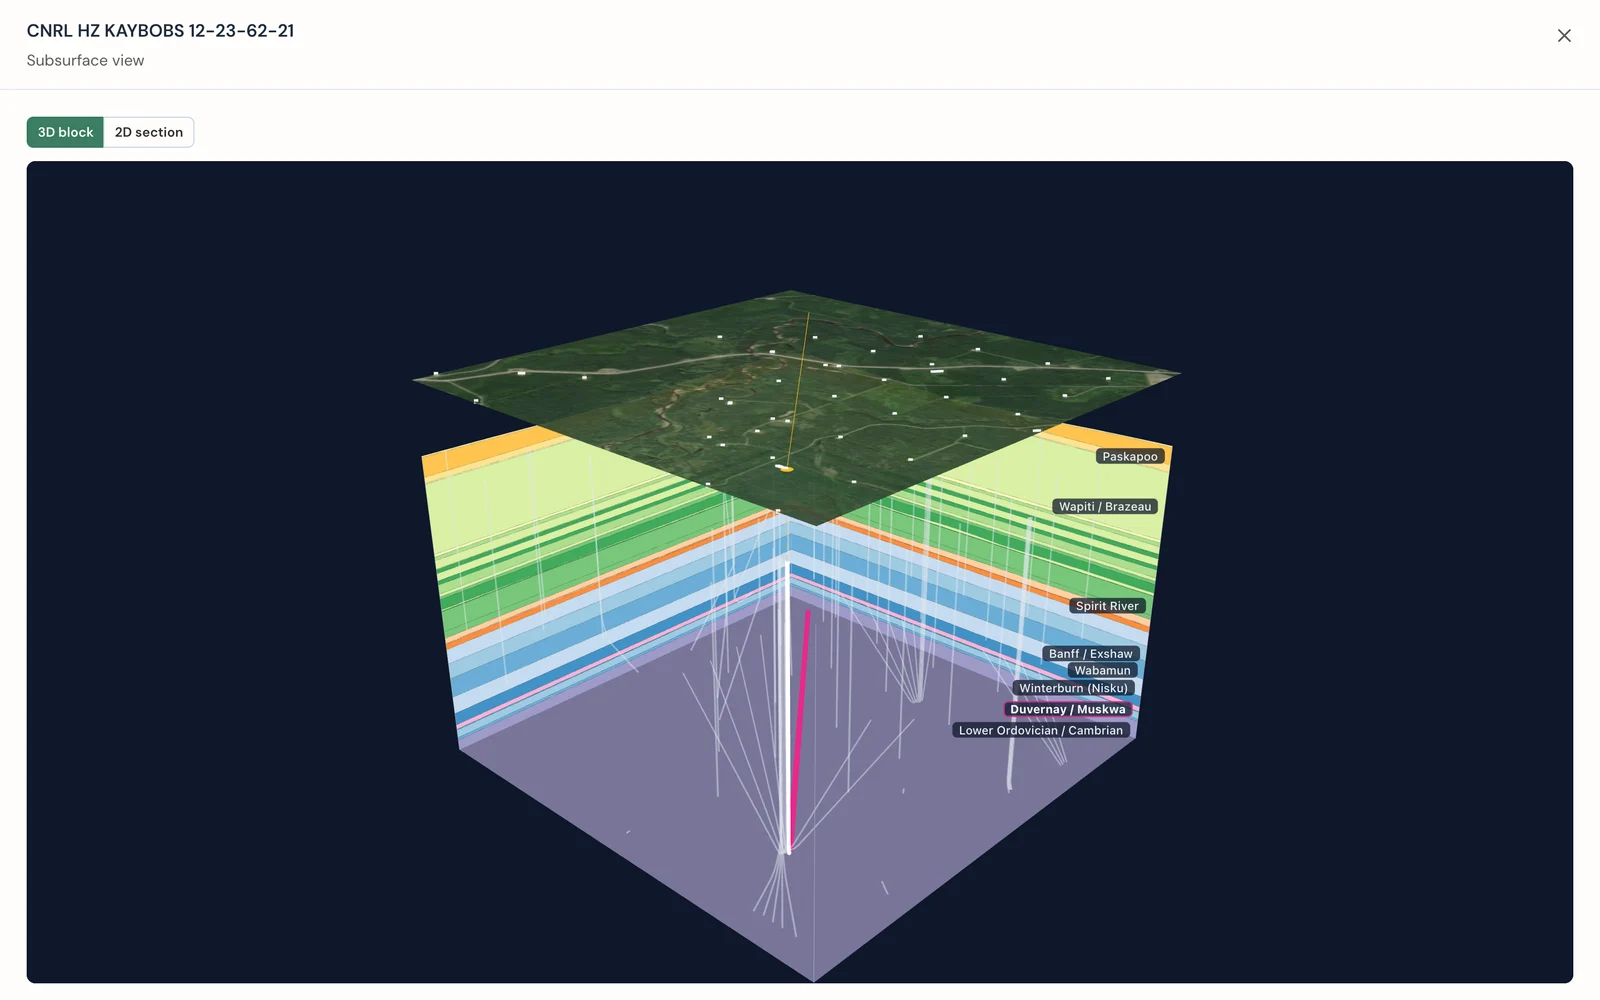
The card opens in 3D. It draws a block of rock at least 3 km across, centred on the well, with each formation as a coloured layer on the walls and its name along the edge. A satellite image of the land floats above the block, with the wellhead marked, so you can tie what is underground to the fields, roads, and lease sites on the surface. Neighbouring wells inside the block appear as pale lines. Drag the block to turn it. The walls nearest you hide themselves, so the well stays in view from any side.
Select 2D for a flat section cut along the well, from the surface hole toward the bottom hole. The formation names sit beside the section, and wells near the section line are drawn in grey. In full screen you can set the vertical exaggeration. Fit stretches the section to fill the frame, which makes thin formations readable. 1×, 2×, and 5× hold a fixed scale, so two wells drawn at the same setting can be compared directly.
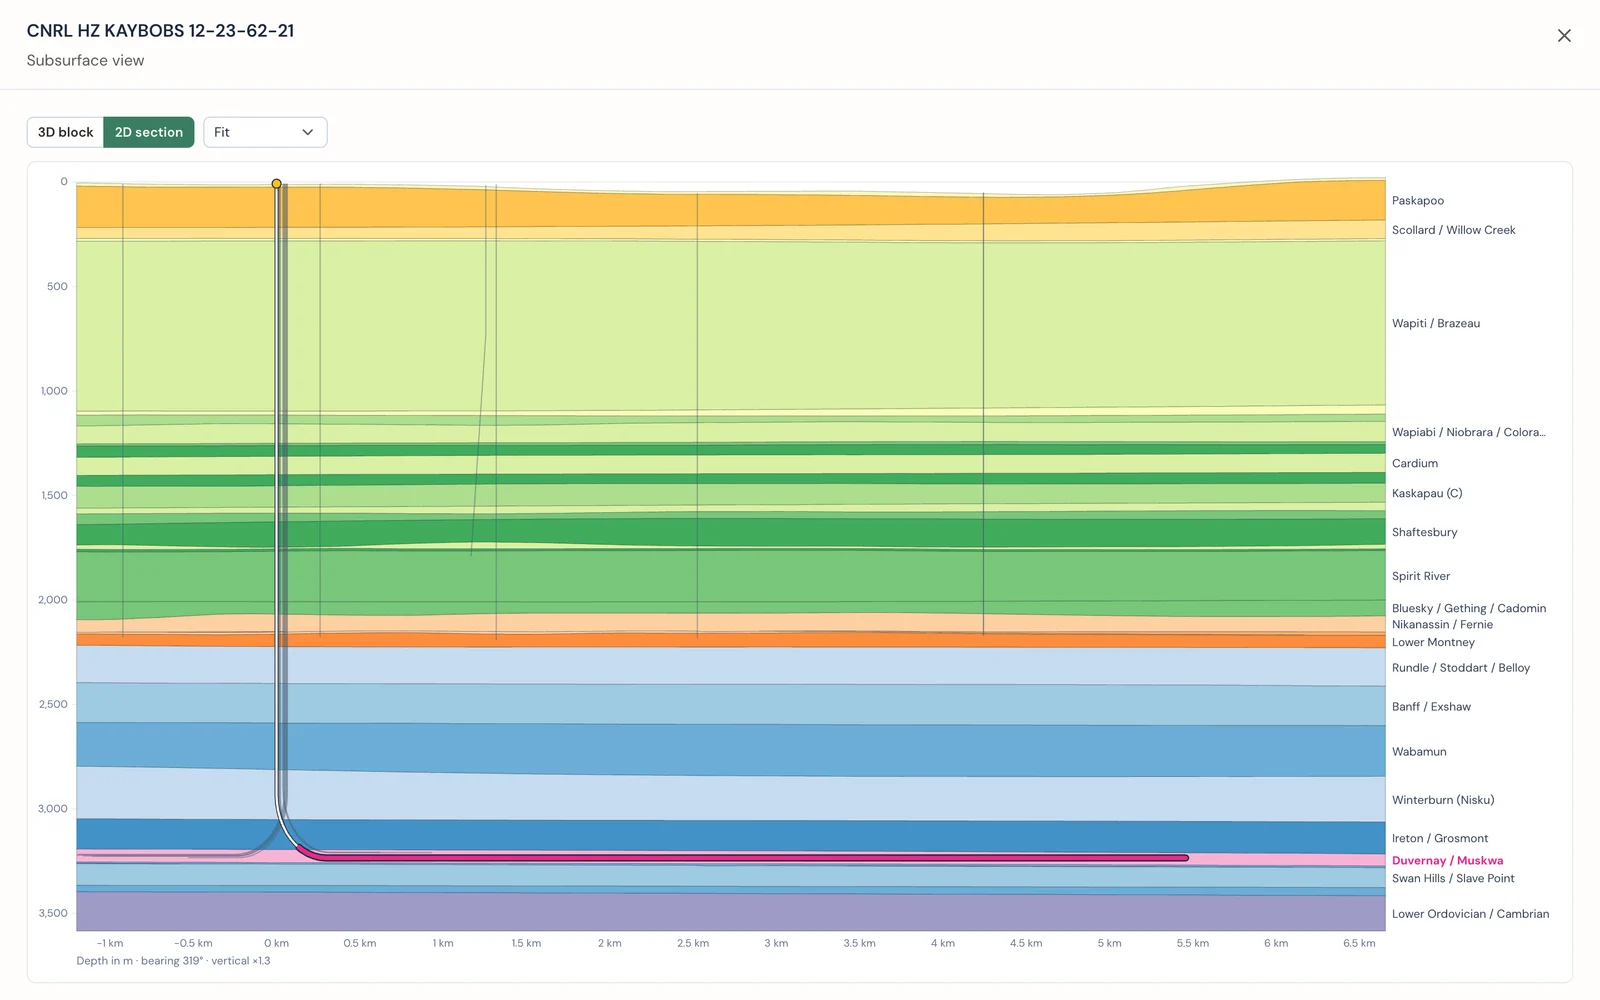
The 3D block is better for seeing where a well sits in its neighbourhood: how close the next laterals run, and which way the layers dip. The 2D section is better for reading depths and thicknesses along the well itself.
The producing zone, traced along the well
The formation a well produces from is drawn in magenta in both views. The zone comes from the well's Petrinex pool, which we match to the formations in the geological model. The well path turns magenta where it runs through that zone, so a horizontal well that stays in its target reads as one long magenta line.
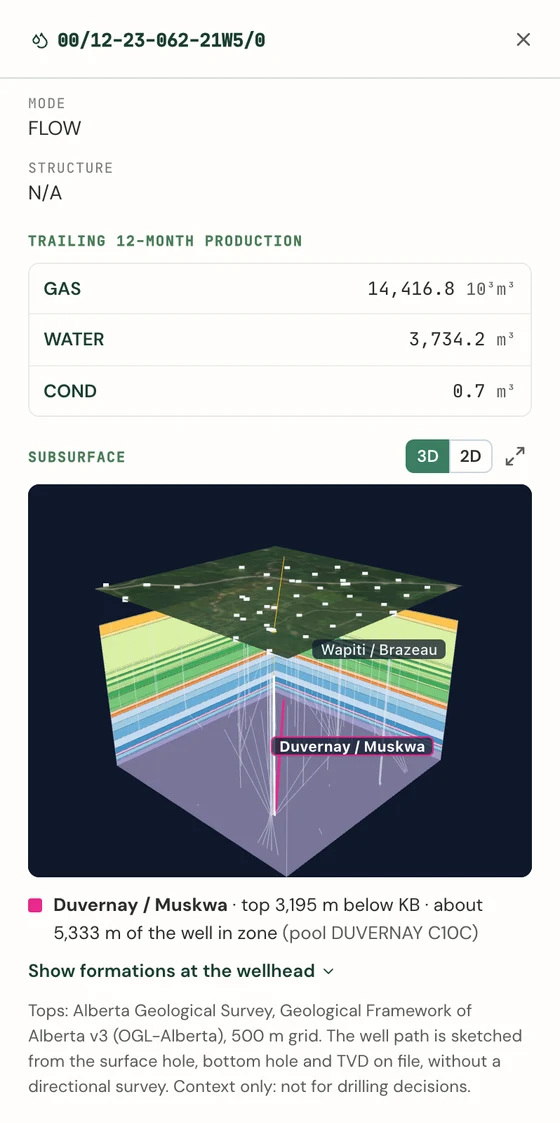
Under the view, one line sums it up. For the Kaybob well, it reads Duvernay / Muskwa, with a top 3,195 m below the kelly bushing and about 5,333 m of the well in the zone, with the Petrinex pool name alongside. Show formations at the wellhead lists every formation under the well with its top depth, from the surface down.
Some pools carry no formation in their name, for example commingled production. Those wells show the geology without a highlighted zone rather than a guess.
In the Energy Report PDF
The Energy Report PDF for an Alberta parcel now carries a geological section running west to east through the parcel, with the AER wells near the line, and a list of the formation tops under the parcel with their depths below ground. A client report gets a picture of what lies under the land, next to the well and tenure tables.
Where the data comes from
The formation tops come from the Alberta Geological Survey's Geological Framework of Alberta, version 3. It is a provincial 3D model of 90 geological units on a 500 m grid, published under the Open Government Licence - Alberta. We use 89 of them. The survey publishes no usable top for the lower Shaftesbury, so the view draws that interval as part of the Shaftesbury above it.
The well path is a sketch. We build it from three facts on the AER well record: the surface hole, the bottom hole, and the true vertical depth. A vertical well drops straight down. A horizontal well builds a curve and then runs out to its bottom hole. The public record has no directional survey, so the drawn path follows the right shape, but it is not the surveyed path.
These two limits shape how to use the view. It is a regional picture of which formations a well crosses and roughly where its target sits. It does not replace the well's logs and survey, and it is not a basis for drilling decisions.
Who it is for
- Landmen and land agents explaining to a landowner what a horizontal well under their quarter is producing from, and why its bottom hole can sit kilometres from the wellhead.
- Surface-rights consultants who want the subsurface picture alongside the wells, pipelines, and tenure on a parcel.
- Acquisition and liability analysts screening which formations an operator's wells target, before opening the technical data.
- Landowners who want to see what lies under their land.
How to open it
- Search a well's UWI, for example
00/12-23-062-21W5/0, or open a parcel's Energy tab and select a well from the Wells card. - Scroll the well detail to the Subsurface card.
- Drag the 3D block, switch to 2D, or open full screen with the expand icon.
The view covers Alberta wells and needs the Energy add-on, which stacks on a Pro or Business plan. The Energy add-on guide covers each control, and pricing lists the add-on and its trial.
The block idea comes from Kyle Walker's day 15 map in his 2026 map challenge, which drew the geology under the land as a 3D block. We pointed the same idea at Alberta's wells, because a well record is much easier to read once you can see the rock it was drilled through.