By Township Canada
Western Canada Soil Survey in One Layer: AB AGRASID, SK Soils, and BC Soil Survey Combined
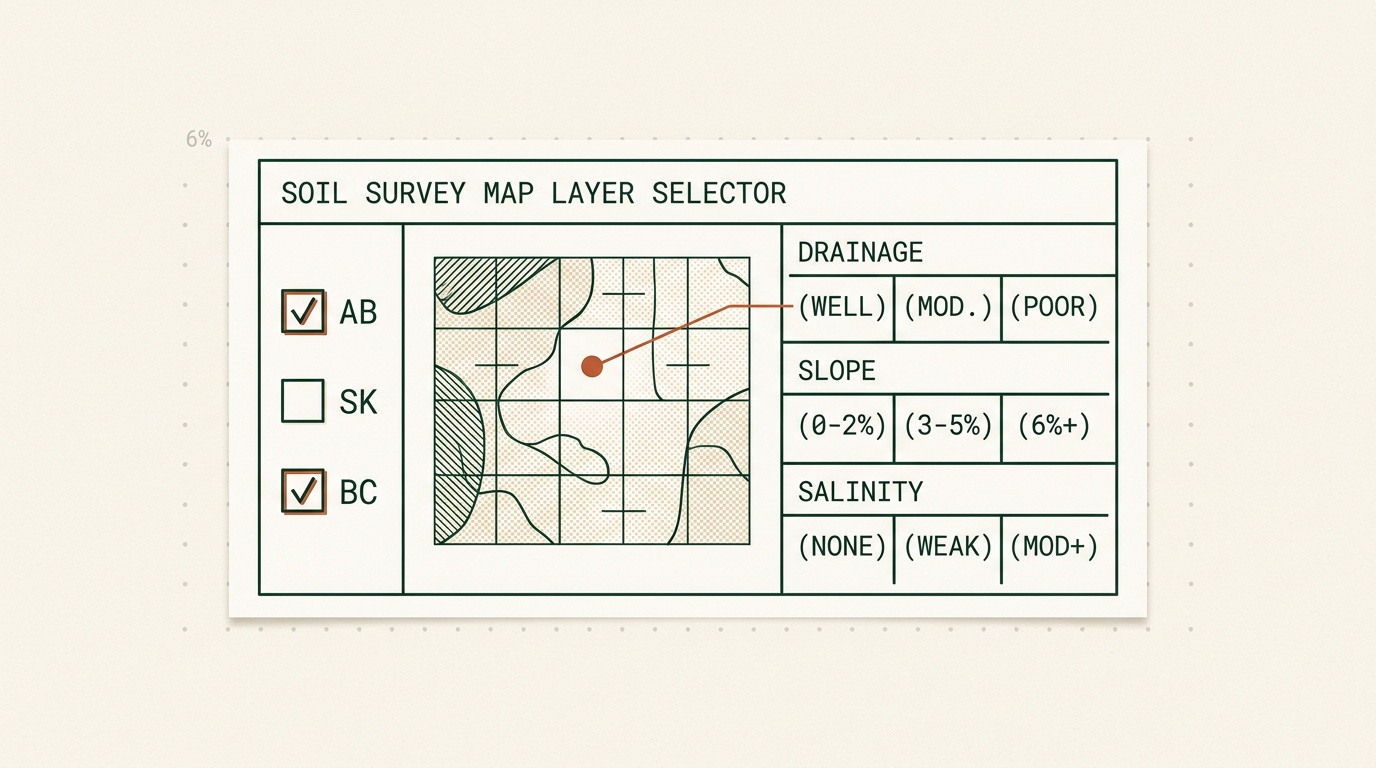
Township Canada now shows a unified soil survey map for western Canada agriculture: AB AGRASID, SK soils, and BC soil survey in one toggle, with drainage, slope, and salinity filter chips.
A farmland buyer in east-central Alberta wants to compare three quarter sections straddling the AB-SK border before bidding next week. The buy team needs drainage class, slope group, and salinity readings on each parcel, side by side, before money moves. Until now that meant toggling a Saskatchewan soil layer, switching to a separate BC layer for the cross-border holding, and finding the Alberta AGRASID polygons in the federal AAFC viewer because they were not on the Township Canada map at all.
That changes today. The new unified Soil Survey map for western Canada agriculture layer combines the Alberta AGRASID dataset, the Saskatchewan provincial soil survey, and the British Columbia soil survey into a single toggle, rendered from tile-joined soils.pmtiles so the map reads like one continuous surface across the three provinces.
The problem: three soil layers, one buying decision
Soil data lived in three separate places, with three sets of attributes, and one of them was missing from our map entirely.
- SK Soils had its own catalog entry, with drainage and slope attributes specific to the Saskatchewan provincial survey.
- BC Soil Survey had a second catalog entry, with the BC survey's own polygon set and slope groupings.
- AB AGRASID, the polygon dataset every Alberta agronomist references, was loaded in the backend but not surfaced anywhere in the agriculture catalog. To compare an AB parcel to its SK neighbour, you opened the federal AAFC viewer in a second tab.
For an agronomist evaluating a parcel near Lloydminster, or a crop insurance adjuster reconciling claims on land that crosses the meridian, that meant three tools and three different attribute conventions for what is essentially the same question: what is the soil, how does it drain, and how steep is it?
How the unified soil survey layer works
The Soil Survey toggle now mounts all three datasets behind one entry in the agriculture catalog. Province checkboxes inside the layer control which jurisdictions render: toggle off BC if you only work the Prairies, or restrict to Saskatchewan for a single-province acquisition pipeline.
Three filter chips sit underneath the province controls:
- Drainage (AB, BC): well-drained through very poorly drained, plus an unreported bucket. Saskatchewan does not publish a directly comparable drainage attribute, so SK polygons sit outside the chip rather than silently render the same as a missing value.
- Slope (AB, SK, BC): three slope-class chips that map onto each provincial survey's own grouping, with an unreported bucket per province.
- Salinity (AB, SK): none, weak, moderate, strong, plus unreported. BC's soil survey does not carry a salinity attribute on most polygons.
The honest unreported buckets are the part worth lingering on. Salinity unreported is not the same as salinity zero: a polygon with no salinity attribute could be a salt flat that was never sampled, or a pristine soil where the surveyor simply did not record the field. The chip surfaces the gap so a downstream reader does not treat "missing" as "safe."
Real example: an AB-SK border buy
Take a three-parcel buy near the border. Two quarter sections on the Alberta side and one across the meridian in Saskatchewan:
- SE-1-48-1-W4 (Alberta, on the meridian): Black Chernozem on AGRASID, slope class 2-5%, drainage imperfect, salinity weak. A reasonable cereal quarter with a small productivity penalty in the lower draws.
- NE-33-49-2-W4 (Alberta, one township north and west): Solonetzic Black Chernozem patches at the south edge, slope class 0-2%, drainage poor on the low ground, salinity moderate. The Solonetzic flag drops the comparable price; the salinity reading explains why a neighbour's barley failed two years running.
- NE-25-48-28-W3 (Saskatchewan, across the meridian): SK soils returns slope group 0.5-2%, salinity none, drainage unreported. The agronomist plans an in-person walk before final offer. The unreported chip is doing real work here: without it, drainage looks like a missing field rather than a gap to verify on the ground.
Three parcels, three soil survey sources, one map, one filter session. The agronomist exports the three parcel reports to PDF and the buy team has soil context before the offer goes in.
What moved, and why
The agriculture catalog shrank from ten entries to eight. The new order is summaries → soils → capability → land administration, which matches the order an agronomist actually reads: AAFC crop summary and the LSRS productivity score first, then soil survey for drainage and salinity, then Ag Capability, then ALR and treaty overlays.
Two entries disappeared into the unified Soil Survey toggle (SK Soils and BC Soil Survey both rolled in). BC Wetlands moved out of agriculture and into the Natural category, beside AB Wetlands. Both wetland datasets now sit together where an environmental consultant expects them: they were never really agriculture layers, but the panel had them stranded on the wrong side of the catalog.
Who this is built for
- Agronomists comparing soils across an AB-SK or AB-BC client portfolio without leaving the map. Pair the layer with Chernozemic, Solonetzic, and Luvisolic reading guides to read polygons in seconds.
- Farmland buyers and investors screening multi-province acquisition pipelines. Drainage and salinity chips are blunt first-pass filters; the LSRS productivity overlay goes deeper per quarter.
- Crop insurance adjusters (AFSC, SCIC) triaging claim events across the border: the unreported buckets prevent false-confidence calls on parcels where the survey simply does not carry the attribute.
- Environmental consultants scoping wetland and soil exposure on multi-province assessments.
How to access
The Soil Survey layer is in the map layers panel at townshipcanada.com/app, inside the agriculture category. It is part of the Agriculture Bundle (add-on on top of Pro or Business, see pricing), which turns on the soil, crop, LSRS, and parcel-report stack across Alberta, Saskatchewan, and British Columbia.
Toggle the layer on, pick your provinces, narrow with the drainage / slope / salinity chips, and the map redraws against the tile-joined soils.pmtiles archive in a single render. The same data flows through the parcel report card for every quarter section that has a covering polygon. Manitoba lands in the same archive once its provincial soil survey is normalized; until then, the unified Soil Survey map for western Canada agriculture covers AB, SK, and BC and stops at the Manitoba border.