
By Township Canada
Buying Farmland in Alberta or Saskatchewan? How to Evaluate Quarter Sections With LSRS Soil Scores Before Making an Offer
Use LSRS soil productivity scores and crop rotation history to compare quarter sections before buying farmland in Alberta. A step-by-step due diligence workflow.
Two quarter sections sit side by side in the same DLS township south of Ponoka, Alberta. Same asking price per acre. Same flat, open prairie in the satellite image. One is Black Chernozem with an LSRS class of 2 (score 82 out of 100). The other is Solonetzic with an LSRS class of 5 (score 34). The difference between those two parcels will show up in yield potential, drainage behaviour, crop insurance premiums, and long-term land value, but only if you check the soil data before you sign.
This post walks through a farmland due diligence workflow using LSRS soil productivity scores, AAFC crop rotation history, and parcel reports to evaluate quarter sections before making an offer.
Why satellite imagery alone is not enough
From 10,000 feet, most cultivated quarter sections in central Alberta look the same: brown in spring, green in July, stubble by October. Satellite imagery tells you the land is being farmed. It does not tell you what the soil can sustain over a 20-year rotation, how well it drains after a wet spring, or whether the dominant soil series limits root depth.
Two adjacent quarters in Township 42, Range 26, W4M illustrate this. NE-14-42-26-W4 sits on well-drained Black Chernozemic loam: deep topsoil, good structure, no salinity limitations. NW-14-42-26-W4, 800 metres to the west, is mapped as Solonetzic: a hardpan B-horizon that restricts drainage and root penetration. Both are cropped. Both look productive in a good year. In a dry year or a wet spring, the Solonetzic quarter underperforms, and the yield gap compounds over time.
The LSRS score surfaces that difference in a single number.
What the LSRS score tells you about a parcel
The Land Suitability Rating System (LSRS) is a national soil and climate suitability index published by Agriculture and Agri-Food Canada (AAFC). It combines climate suitability, soil suitability, and landscape factors into a class rating from 1 (excellent) to 7 (unsuitable for spring-seeded small grains). Township Canada translates that class into a 0-to-100 score for easier comparison between parcels.
For a detailed breakdown of what each class means and what LSRS does not measure, see LSRS Explained: What the Score Actually Tells You.
For farmland buyers, the score answers a specific question: given typical management, what is this quarter section's long-run suitability for grain production relative to its neighbours? A class-2 parcel (score 75-89) will consistently outperform a class-4 (score 45-59) under the same rotation and inputs. That gap is structural. It does not close with better equipment or a new operator.
How to pull LSRS data for any quarter section
Open Township Canada and search for a legal land description. For this example: NE-14-42-26-W4. The search returns the quarter section on the map with its GPS centre point and boundary polygon.
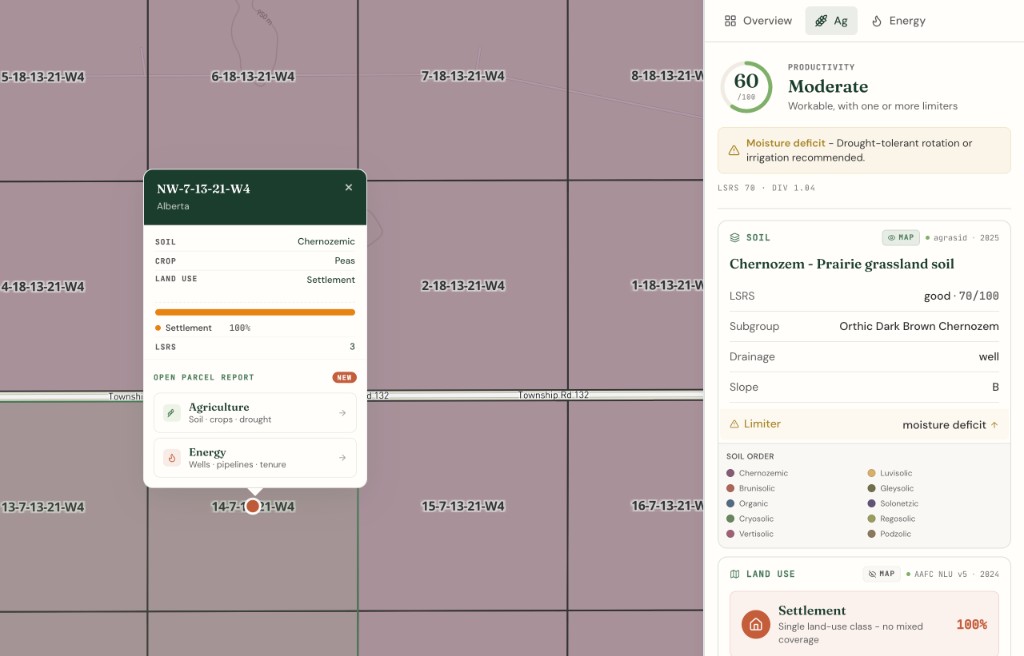
Open the parcel report by clicking the result. The Agriculture tab (requires the Agriculture Bundle add-on) shows:
- LSRS Productivity Score: class, numeric score (0-100), label, and the limiting factor (climate, soil, or landscape)
- Dominant soil: order, group, subgroup, drainage class, slope, and parent material from AGRASID
- 5-year crop rotation: what has actually been grown on this quarter section, year by year, from AAFC Annual Crop Inventory data
- Land use classification: AAFC land-use and IPCC class breakdown
- Current drought status: Canadian Drought Monitor classification
All of this is for the specific quarter section you searched, not a regional average.
Comparing two parcels: a Lacombe-area example
Here is what a side-by-side comparison looks like in practice. Take two adjacent quarters near Lacombe:
NE-14-42-26-W4 (Black Chernozem)
- LSRS class 2, score 82
- Limiting factor: minor climate limitation (shorter frost-free period at this latitude)
- Soil: Black Chernozemic, loam texture, well-drained
- Crop rotation: canola-wheat-canola-barley-canola (5-year pattern)
- The rotation confirms what the LSRS predicts: this is productive grain land supporting a tight canola-cereal rotation
NW-14-42-26-W4 (Solonetzic)
- LSRS class 5, score 34
- Limiting factor: soil (hardpan, poor internal drainage, moderate salinity)
- Soil: Solonetzic, clay loam, imperfectly drained
- Crop rotation: barley-barley-forage-forage-barley (5-year pattern)
- The rotation tells a different story: the operator has shifted toward forage, which tolerates the drainage limitation better than canola
Same township, same section, same asking price. The LSRS score and crop history together give you the evidence to negotiate differently on each parcel, or to walk away from one.
Cross-referencing LSRS with crop rotation history
The LSRS score is a long-run structural rating. The AAFC crop rotation history is the operational evidence of what the land actually produces year over year.
When the two align (high LSRS, consistent high-value crop rotation), the parcel's productivity claim is validated. When they diverge, something is worth investigating:
- High LSRS, low-value rotation: the land has potential but may be under-managed. Could be an opportunity for a buyer who plans to intensify.
- Low LSRS, high-value rotation: the operator is pushing the land hard. Check for signs of soil degradation, rising input costs, or declining yields that the LSRS predicted.
- Consistent forage on a class-3+ parcel: the quarter may have localized drainage or salinity issues that the LSRS captures at the dominant-polygon level but that satellite imagery hides.
For step-by-step instructions on reading crop history data, see the AAFC crop history walkthrough.
Building a due diligence package with the parcel report
Once you have identified a shortlist of candidate quarter sections, the parcel report gives you everything a lender or agronomist needs in one export:
- Legal land description (DLS notation)
- GPS coordinates (centre point)
- Boundary polygon
- LSRS productivity score and limiting factor
- Dominant soil series and drainage class
- 5-year crop rotation from AAFC
- Current drought classification
Export the report as a PDF from the parcel report page. For buyers evaluating multiple parcels across a region, the batch conversion tool converts a list of legal land descriptions to GPS coordinates in one step, so you can map every candidate parcel before driving out to inspect them.
A complete guide to the soil and crop checks available in the parcel report is at Farmland Due Diligence: Soil and Crop Checks.
Saskatchewan coverage
LSRS productivity scores are currently available for Alberta quarter sections, calculated from AGRASID 4.1 soil data. Saskatchewan does not yet have LSRS coverage in Township Canada.
Saskatchewan buyers can still use Township Canada for farmland evaluation. The unified soil survey layer covers SK with detailed soil polygon data (soil order, drainage, texture) from provincial soil surveys. AAFC crop rotation history and land-use classification are national datasets and available for any SK quarter section. Drought monitoring is also national.
So while you cannot pull a single LSRS score for an SK quarter today, you can still compare soil characteristics and crop history between parcels, which covers much of the due diligence workflow described above.
Timing matters: July to September is peak transaction season
Western Canadian farmland transactions peak between July and September. Sellers list after seeding is done, and buyers want to close before fall so they can plan next year's rotation. That means the window for soil-level due diligence is short.
Pulling LSRS data and crop history before your first site visit saves time in the field. You arrive knowing which quarters have structural soil limitations, which ones are running tight canola rotations that validate high productivity, and which ones have rotation patterns that suggest the land is being pushed beyond its rating. That context changes the questions you ask the seller and the price you put on the table.