By Township Canada
Pipeline Class Location in Alberta: Scoping the Review with AER ST76 Data on the DLS Grid
Put an AER ST76 pipeline segment, the survey grid, satellite imagery, and nearby wells in one map view to scope a class location review in Alberta.
A class location review starts with a simple question that takes a long time to answer: what has been built along this pipeline since it was licensed? Class location is set by the population density along the line. A segment designed for open farmland can sit next to a new country residential subdivision ten years later, and the class it was designed for may no longer match what is on the ground. Because class drives the design factor and the integrity obligations that follow, an outdated class is not a paperwork problem.
The counting itself is your job. The rules for the assessment area and the dwelling thresholds for each class are set in CSA Z662, and they are worth checking against the current edition before you start. What slows the work down is usually not the counting. It is getting the pipeline, the survey grid, and the imagery into the same view so you know where to count.
The usual workflow: three tools and a spreadsheet
For most land and integrity technicians, one segment means several stops. The route and licence details come from the AER ST76 pipeline data. The parcels come from a provincial viewer. The dwellings come from satellite imagery in a third tool. The results end up in a spreadsheet keyed by legal land description, because that is how the licence, the right-of-way, and the landowner contacts are all filed.
Every switch between tools is a chance to look at the wrong quarter section. When a line crosses a township boundary or runs diagonally across several LSDs, keeping the legal land descriptions straight takes as long as the imagery review.
Reading an ST76 segment on the map
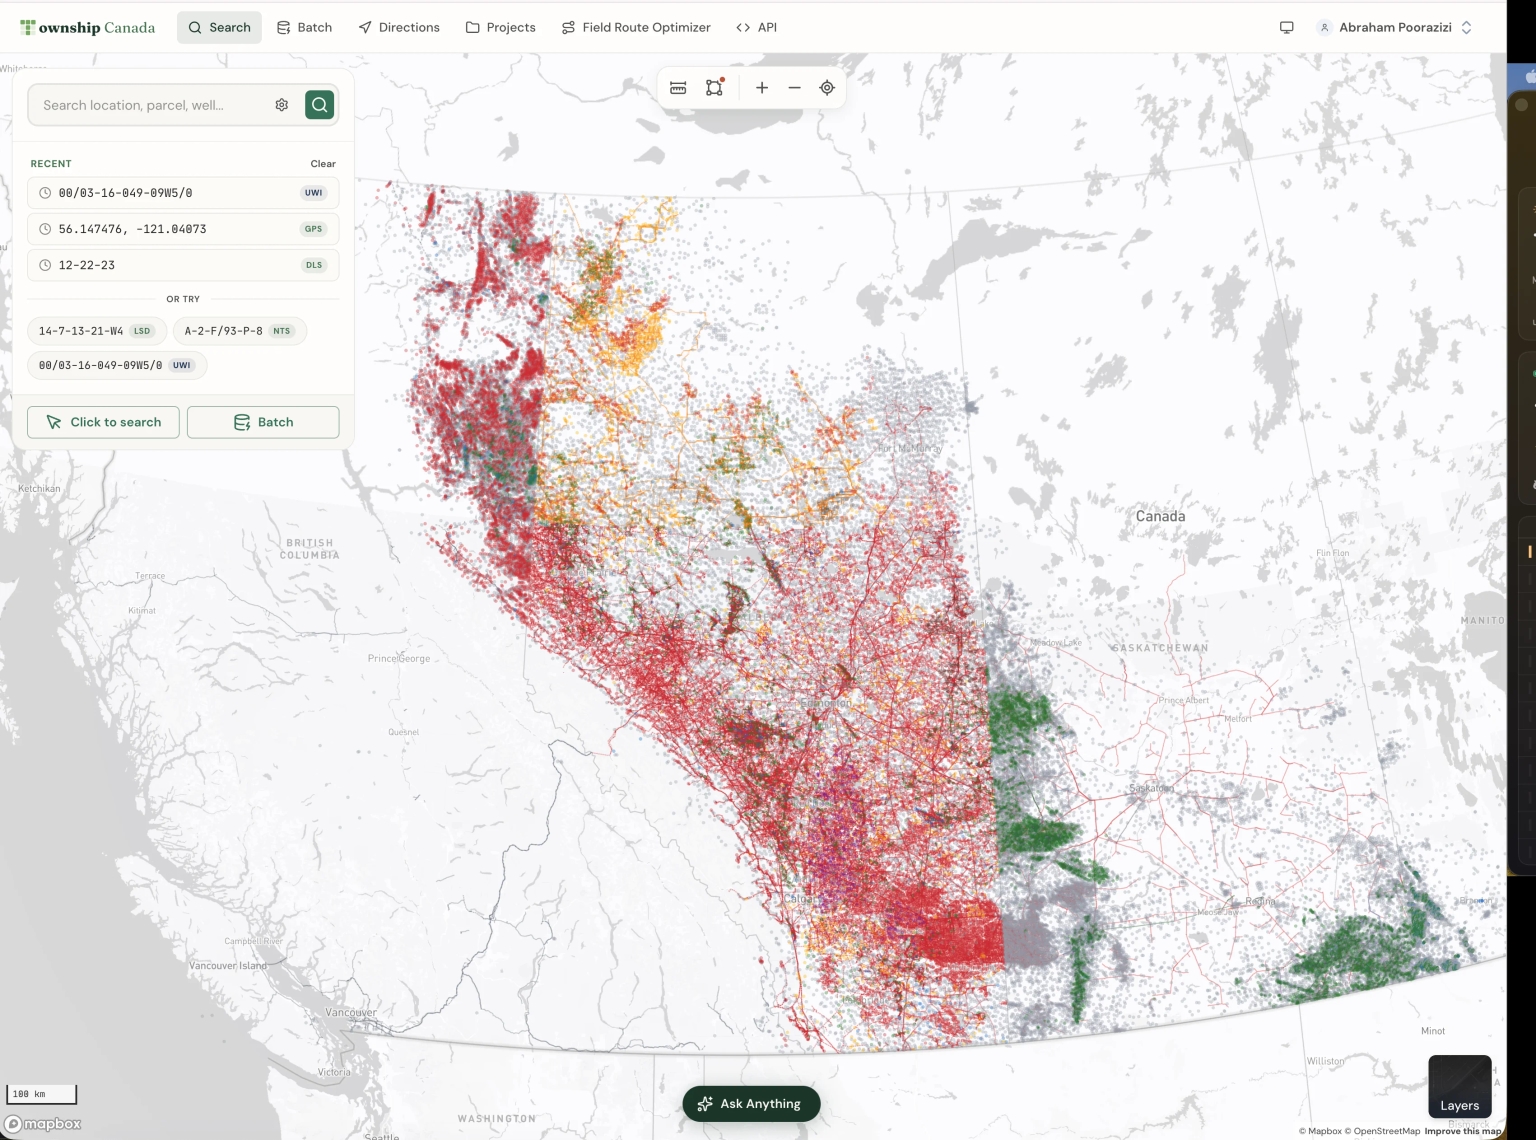
In Township Canada, open the Layers panel and turn on Pipelines. The layer draws licensed pipeline segments across Alberta, Saskatchewan, and British Columbia (Manitoba publishes no open pipeline layer). Line colour shows the substance and the dash pattern shows the status, so you can tell an operating sour gas line from a discontinued oil line before you click anything.
Click a segment and the popup gives you its licence number, status, substance, operator, and province. For Alberta, the source is the AER's ST76 pipeline data, refreshed monthly. The AER ST76 pipelines page lists every field we carry and how the layer is built.
The segment sits on the DLS grid, so the quarter sections and LSDs it crosses are labelled right on the map. Switch the base map to satellite imagery and you can see the houses, yards, and buildings near the line in the same view. The measure distance tool on the map toolbar lets you check how far a structure sits from the line.
What the licence record says about class
The Alberta ST76 record also carries the class location on file for each segment. Township Canada keeps that field with each pipeline crossing in the parcel report data, and the written pipeline summary in the Energy Parcel Report PDF draws on it. The map popup does not show it.
Treat that value as the class on file, not as a current assessment. The whole point of a class location review is to check whether development since licensing has changed the answer. The Saskatchewan and British Columbia records we load do not carry a class location field.
Seeing the operating context around the line
A pipeline rarely runs alone. Turn on Wells and Facilities with the Pipelines layer, and the batteries, compressor stations, and well sites the line connects to appear in the same view. That context helps when you need to explain why a segment runs where it does, or which facility sits at each end of it.
For a closer look at one LSD, search its legal land description, for example 14-7-13-21-W4, and open the Energy tab of the parcel report. The Pipelines card lists every segment that crosses that LSD, with substance, licence number, status, diameter, pressure, H2S level, and the length of pipe on the parcel. Open a licence to see all of its segments, not only the ones on this parcel.
Documenting the review by legal land description
A practical way to use this for a class location review:
- Search a legal land description along the route, and turn on Pipelines with a satellite base map.
- Follow the segment and note each quarter section and LSD it crosses. The grid labels give you the descriptions to record.
- Review the imagery along the line for dwellings and other buildings, and use the measure tool where distance matters.
- Open the parcel report for LSDs where development is close to the line, and export the Energy Parcel Report PDF for the file. Each PDF records the pipeline crossings on that parcel with their sources.
- Record your dwelling counts against the same legal land descriptions, so the next review starts from your notes rather than from scratch.
This does not replace a field check. Imagery has a capture date, and a new house may not be on it yet. However, it lets you spend field time on the segments where development has actually changed, instead of driving every kilometre of the line.
What you need
The Wells layer is free on every paid plan. The Pipelines and Facilities layers, the Energy tab of the parcel report, and the Energy Parcel Report PDF are part of the Energy add-on (the Energy Bundle), which stacks on a Pro or Business plan. It costs $180 CAD a month or $1,800 a year and includes 100 parcel reports a month. Current prices are on the pricing page.
For a broader look at the pipeline layer, read the AER pipelines map guide. For how other oil and gas teams use the survey grid, see legal land descriptions in oil and gas, or browse oil and gas data by field, operator, and township.